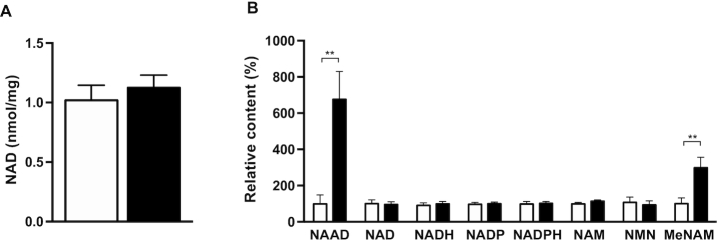
FIGURE 2.
NAD+ metabolites in skeletal muscle after NR and placebo supplementation. (A) NAD+ concentrations measured in skeletal muscle biopsy specimens by enzymatic assay, n = 8. (B) NAD+ metabolites measured in skeletal muscle biopsy specimens by MS, n = 12. Black bars are NR, open bars are placebo. Data are expressed as mean ± SE. P values are derived from the analysis of the mean within-person changes and the SEM of the within-group changes. **P < 0.01. MeNAM, methylnicotinamide; NAAD, nicotinic acid adenine dinucleotide; NAM, nicotinamide adenosine mononucleotide; NMN, nicotinamide mononucleotide; NR, nicotinamide riboside.

