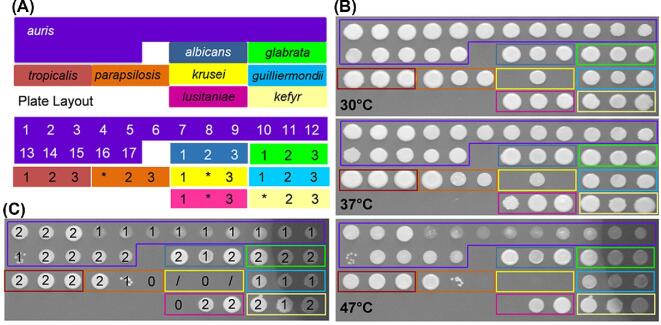
Figure 1.
Comparison of C. auris thermotolerance with other Candida pathogens. (A) The microtiter plate layout of the Candida clinical isolates listed in Tables 1 and 2. Misidentified isolates are highlighted with an asterisk. (B) Growth of Candida isolates for 24 h on YPD agar at the stated temperatures. (C) Illustration of the semi-quantitative analysis of stress resistance, where 0 = no growth, 1 = less growth, 2 = ‘normal growth’ 3 = more growth, in comparison to the same isolate grown on YPD at 30°C, using the 47°C panel from (B) which illustrates one representative of six replicates. Data from the six replicate experiments were used to generate the averages presented in Tables S1 and S2. Note that while ‘C. krusei’ strains were included in the panel (yellow), for technical reasons these were excluded from our data analysis. This Figure is reproduced in color in the online version of Medical Mycology.

