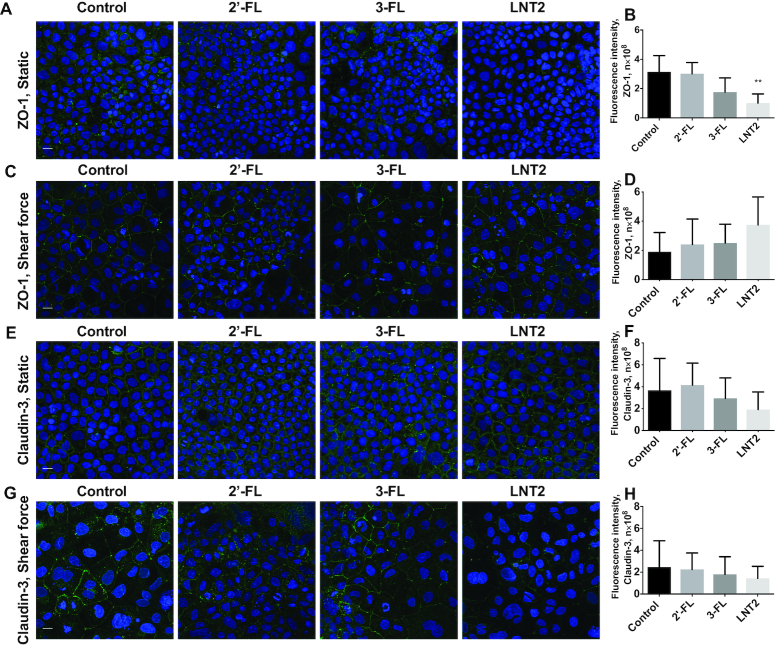
FIGURE 3.
hMOs (2′-FL and 3-FL) and hMO's acid hydrolysis product (LNT2) differently modulate protein expression of tight junction in intestinal epithelial Caco-2 cells. (A, C) immunofluorescence images of tight junction protein ZO-1 (ZO-1, green; cell nuclei, blue) with 2′-FL, 3-FL, and LNT2 stimulation under static conditions and shear force, respectively; (B) and (D) immunofluorescence intensity analysis of (A) and (C), respectively. (E, G) immunofluorescence images of tight junction protein claudin-3 (claudin-3, green; cell nuclei, blue) with 2′-FL, 3-FL, and LNT2 stimulation under static conditions and shear force, respectively. (F) and (H) immunofluorescence intensity analysis of (E) and (G), respectively. Scale bar = 20 μm. Values are means ± SDs, n = 6. Asterisks indicate different from control: **P <0.01. FL, fucosyllactose; LNT2, lacto-N-triose II; ZO-1, zonula occludens.

