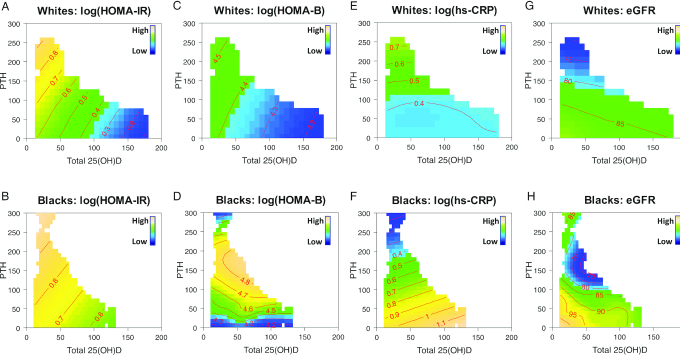
FIGURE 1.
Estimated concurrent associations of 25(OH)D and PTH on HOMA-IR (A–B), HOMA-B (C–D), hs-CRP (E–F), and eGFR (G–H) by race (blacks compared with whites). A penalized spline-based semiparametric model with contour plots was performed for each cardiometabolic biomarker among white (n = 1500) and black women (n = 1300). In the color-filled contour plot, the mean concentrations of each cardiometabolic biomarker at all 25(OH)D–PTH combinations in blacks and whites are indicated by the numbers on the contour lines, adjusting for age, clinical center, education, season of blood draw, BMI, cigarette smoking status, alcohol consumption, postmenopausal hormone therapy, and physical activity levels. The SDs for each outcome were 0.67 for log(HOMA-IR), 0.52 for log(HOMA-B), 1.17 for log(hs-CRP), and 12.97 for eGFR in white women; and 0.82 for log(HOMA-IR), 0.64 for log(HOMA-B), 1.18 for log(hs-CRP), and 18.03 for eGFR in black women. eGFR, estimated glomerular filtration rate; HOMA-B, homeostasis model assessment of β-cell function; hs-CRP, high-sensitivity C-reactive protein; PTH, parathyroid hormone; 25(OH)D, 25-hydroxyvitamin D.

