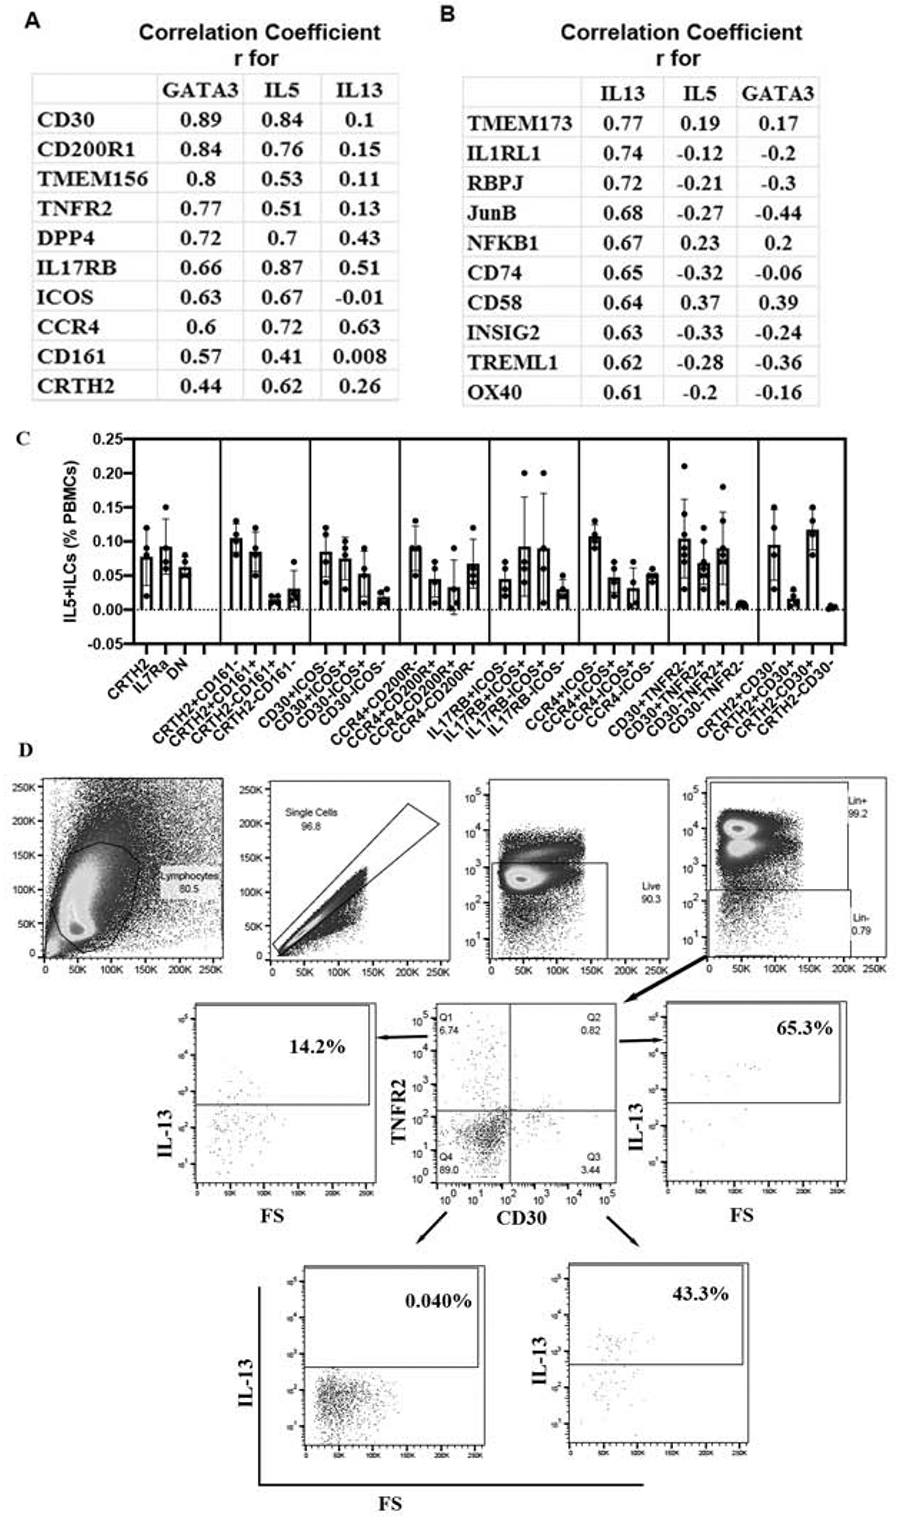
Figure 6.

A list of the top genes that correlated with GATA3 and type-2 cytokines, and their surface expression on ILC2 populations. RNA-seq data was analyzed for Pearson correlation (r) with type-2 genes, and the top genes that correlated with GATA3/IL5 and IL13 are shown in panels A & B, respectively. C: PBMCs from asthmatic patients were cultured with IL2/IL25 for 5 days, stained for flow cytometry and then analyzed for expression of IL5 by CD45+lin- cells expressing various combination of surface markers (N=4 for CCR4/CD200R, CCR4/ICOS, IL17RB/ICOS, CD30/ICOS and CD30/CRTH2; N=7 for CD30/TNFR2). D: Representative flow cytometry plots from a single donor showing the gating strategy for CD30 and TNFR2 expressing ILCs and their expression of IL13.
