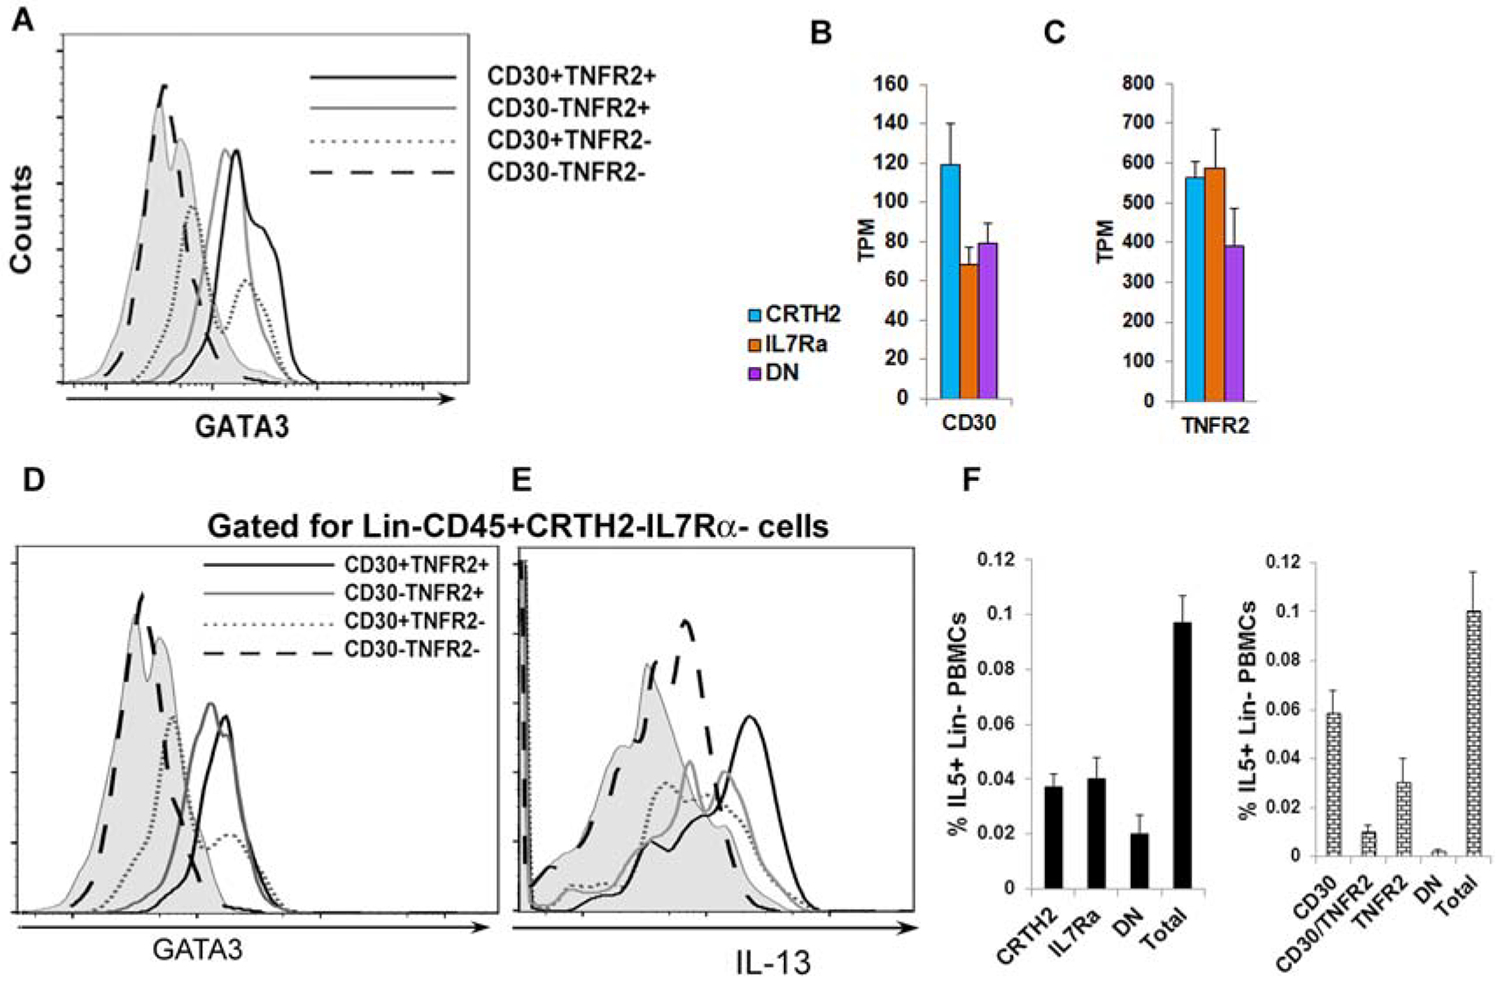
Figure 7.

CD30/TNFR2 as ILC2 surface markers. A: A histogram of expression of GATA3 in various populations of lin-CD30/TNFR2 +/− cells. PBMCs were cultured with IL2/IL25 for 5 days, stained for flow cytometry and then gated sequentially for live mononuclear cells, single cells, lin- cells, CD30+TNFR2+, CD30+TNFR2−, CD30-TNFR2+ and CD30-TNFR2- cells. The expression of GATA3 was analyzed in the latter 4 ILC populations (N=4). B & C: Expression of mRNA for CD30 and TNFR2 in ILC populations as measured by RNA-seq. D & E: Expression of GATA3 and IL13 in DN, CD30/TNFR2+/− cells. PBMCs were cultured with IL2/IL25 for 5 days, stained for flow cytometry and then gated sequentially for live mononuclear cells, single cells, CD45+, lin- cells, CRTH2-IL7Ra-, CD30+TNFR2+, CD30+TNFR2−, CD30-TNFR2+ and CD30-TNFR2- cells. The expression of GATA3 and IL13 in the latter 4 ILC populations is shown (N=3). F: Comparison of flow cytometric enumeration of IL5+ ILCs in PBMCs using the CRTH2/IL7Rα and CD30/TNFR2 antibody-based detection approaches. IL5+ cells were first analyzed in lin- cells (Total). The lin- cells were then gated for CRTH2/IL7Rα (left) or CD30/TNFR2 (right) and IL5 expression was analyzed in the indicated cell populations (N=4). CD30: CD30+TNFR2−; TNFR2: CD30-TNFR2+; DN: CD30-TNFR2−.
