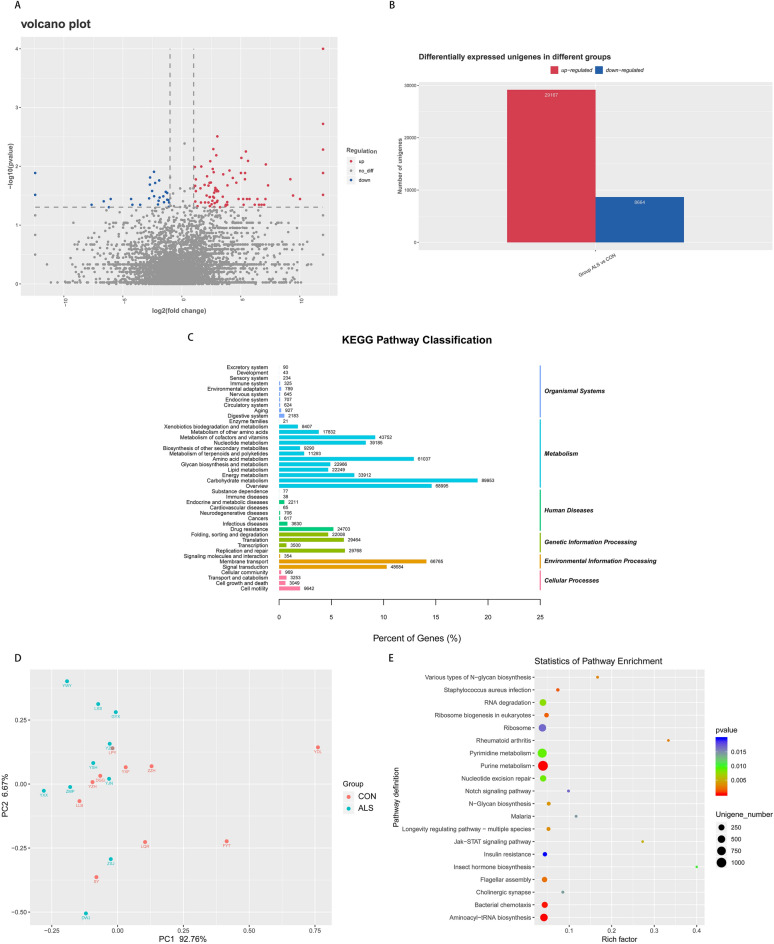
Figure 3.
The expression pattern of Unigenes and gene functional annotation. (A) The volcano plot exhibits the overall distribution of Unigenes, where red dots represent the up-regulated ones, blue the down-regulated ones, and gray the ones that are not significantly different. (B) Statistical histogram of differentially expressed Unigenes. (C) Functional annotation of the whole Unigenes shown as 42 categories of KEGG pathways. The right and left vertical axis respectively refer to the primary and secondary classification information of KEGG pathway. (D) KEGG enrichment scatterplot in which 29 pathways are annotated with differentially expressed Unigenes. Rich factor measures the number of differential genes located in the specific KEGG, and larger rich factor indicates higher degree of enrichment. (E) PCA based on KEGG annotation reveals intra-group similarity and inter-group difference and shows that ALS group differs from CON group in the functional profiles. Each point represents a functional profile of the participants, which of the same group are presented in the same color. PC1 and PC2 refer to the principal components and the percentages shows the extent of variation explained. Dataset reference: Kanehisa, M. & Goto, S. KEGG: kyoto encyclopedia of genes and genomes. Nucleic Acids Res 28, 27–30, 10.1093/nar/28.1.27 (2000).

