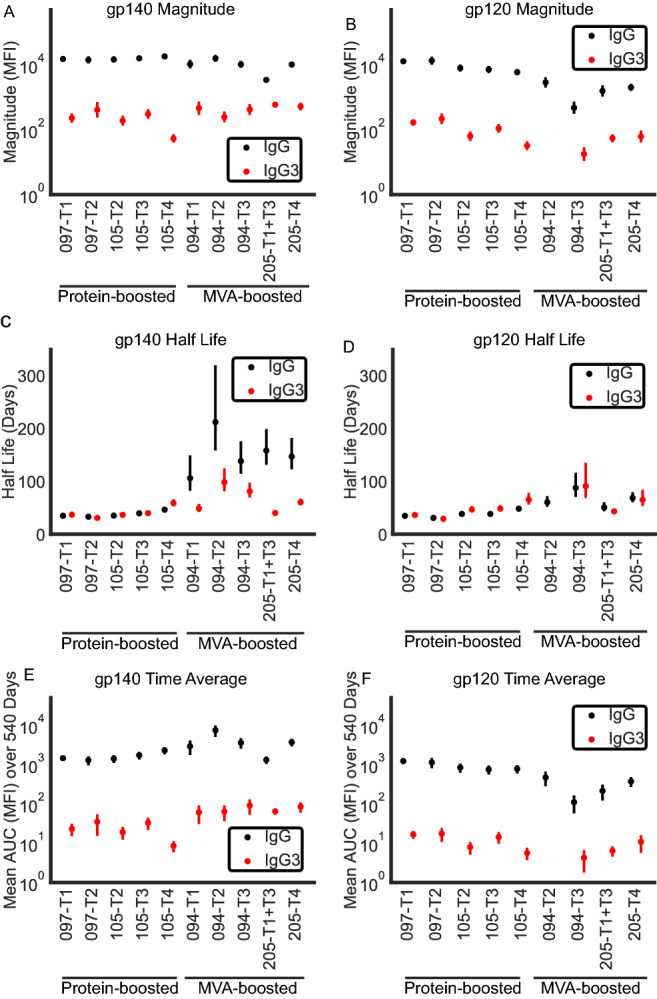
Figure 1.

Results of linear model: peak magnitudes (mean MFI for trial across individuals), half lives, and time-averaged mean response of IgG and IgG3 responses to Con S gp140 and Con 6 gp120. Estimated magnitude of response at peak (net MFI) to (A) gp140 and (B) gp120. Estimated half life of antibody response (days) to (C) gp140 and (D) gp120. Estimated time-averaged mean response to (E) gp140 and (F) gp120 across first 540 days after first vaccination. Error bars represent standard error. Refer to Table 1 for the trial-specific strategies. Color represents the isotype of antibody (black IgG, red IgG3). 105-T3 (DNA-protein) lacked sufficient nonzero IgG3 responses against gp120 in the first 540 days post-peak for inclusion.
