
Figure 2.
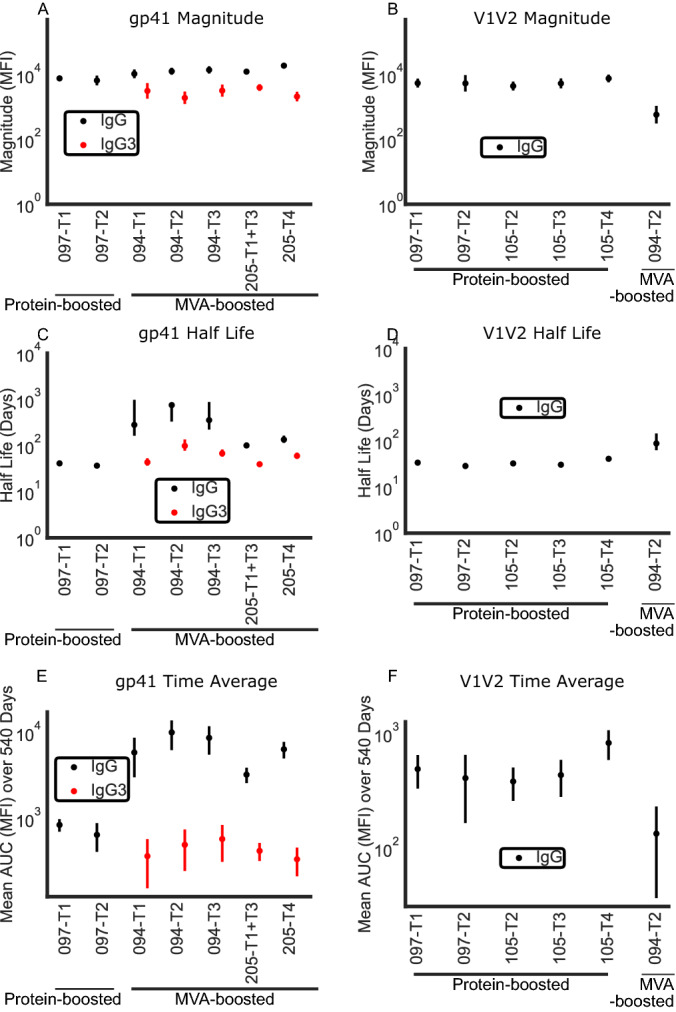
Results of linear model: peak magnitudes (mean MFI for trial across individuals), half lives, and time-averaged mean response of IgG and IgG3 responses to gp41 and gp70_B.CaseA_V1V2. Estimated magnitude of response at peak (net MFI) to (A) gp41 and (B) V1V2 region. Estimated half life of antibody response (days) to (C) gp41 and (D) V1V2 region. Estimated time-averaged mean response to (E) gp41 and (F) V1V2 region across first 540 days after first vaccination. Error bars represent standard error. Refer to Table 1 for the trial specific strategies. Color represents the isotype of antibody (black IgG and red IgG3). Many trials lacked sufficient response to V1V2 (IgG and IgG3) and gp41 IgG for inclusion in model. 097-T1 data for gp41 IgG3 was excluded based on lack of decrease from peak to subsequent time point.