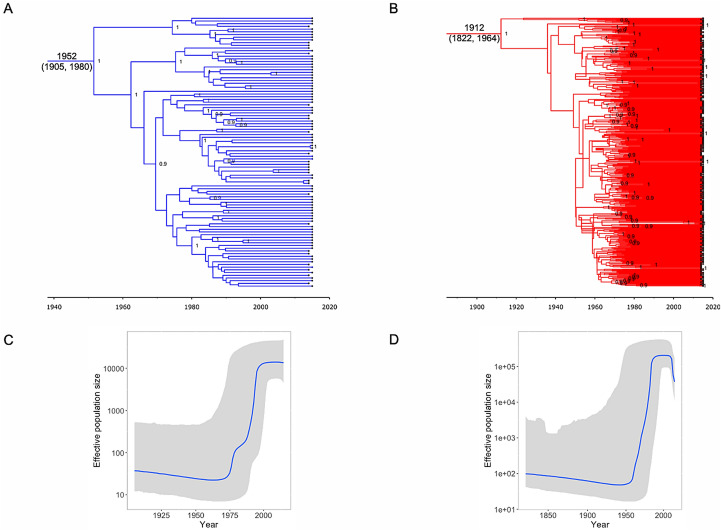
Figure 2.
Bayesian estimation of the epidemic history of NS5A GT1a clades in Spain. Maximum clade credibility trees for each of the clades, clade I (A) and clade II (B) are presented with the mean tMRCA (95% HPD interval) estimates in calendar years annotated at the root nodes for each of the GT1a clades. Posterior probability cut-off value ≥ 0.9 are annotated at the nodes. The Bayesian skyline plots (BSP) for GT1a clade I (C) and GT1a clade II (D) showing the epidemic growth over time are presented. The solid blue line represents the changes in the median effective population size through time on a log10 scale, with the grey shaded area corresponding to the 95% highest posterior density (95% HPD) interval.

