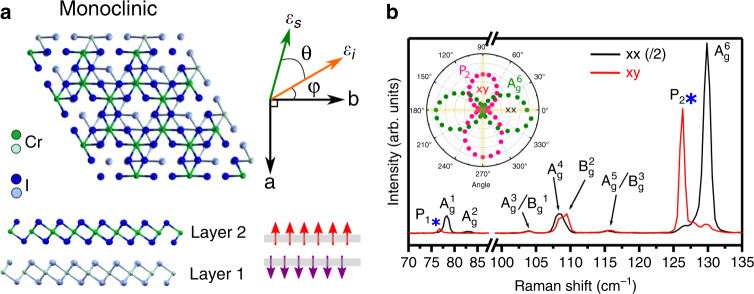
Fig. 1. Crystal structure and Raman spectra of CrI3.
a Top and side views of two layers of CrI3 with monoclinic structure and a schematic defining angles θ and φ with respect to the a- and b-crystal axes and the polarization vectors of the incoming εi and scattered εs light. The two CrI3 layers are color-coded differently. b Raman spectra for both xx (black) and xy (red) polarization configurations at T = 5 K and B = 0 T. Spectra in xx were divided by two for clarity. Peaks that appear below Tc are highlighted with blue asterisks. Inset shows intensity as a function of θ for P2 and in a polar plot.

