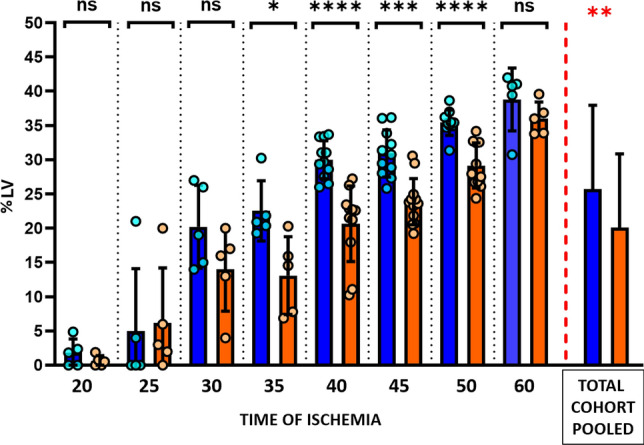
Fig. 5.

Absolute infarct size according to duration of ischemia in metoprolol and vehicle-treated pigs. Infarct size as % of the left ventricle at 7-day CMR follow-up in groups allocated to different lengths of ischemia. Blue columns represent vehicle groups; orange columns represent metoprolol groups. Pooled total cohorts represent animals receiving vehicle (blue) versus animals receiving metoprolol (orange) irrespective of ischemia duration. Data are presented as median and IQR. Dots represent data for individual animals. ns non-significant; *p < 0.05, **p < 0.01, ***p < 0.001, ****p < 0.0001. LV left ventricle
