Figure 4.
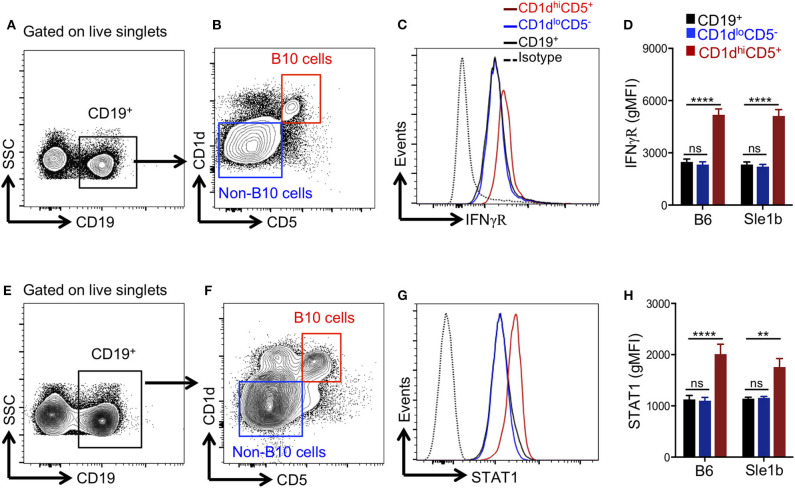
B10 cells show higher STAT1 and IFNγR expression. Representative flow cytometric gating strategy (A,B,E,F) and overlay histograms (C,G) show expression of IFNγR (C), and total STAT1 (G) in indicated cell populations derived from Sle1b mice. The bar diagrams show geometric mean fluorescence of IFNγR (D) and STAT1 (H) in CD19+ total B cells, CD1dhiCD5+ B10 cells, CD1dloCD5− non-B10 cells from B6 and Sle1b mice. These data represent 2 independent experiments. Statistical analysis was performed by one-way ANOVA, with a follow-up Tukey multiple-comparison test. ns, non-significant, **p < 0.01, and ****p < 0.0001.

