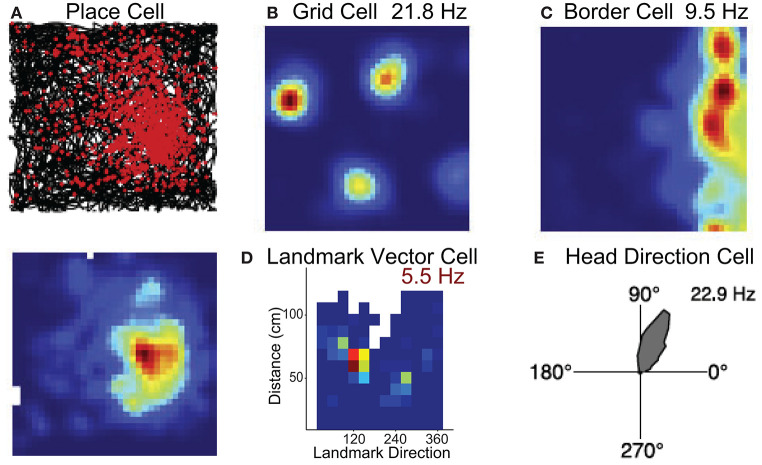
Figure 2.
Neural substrates of spatial navigation. Five examples of single units that exemplify the encoding present in several regions that encompass the brain network critical for spatial navigation. (A) Example place cell recorded in hippocampus, top row is a spike/path plot, red dots represent the locations of action potentials and black lines the path of the animal. (B,C) Example grid cell and border cell recorded in parahippocampal cortex. Colormaps are standard evenly spaced colormaps and the peak firing rate is indicated. (D) Colormap for a cell in hippocampus that encodes the direction and distance of an environmental landmark. Data are from Wilber et al. (2014). (E) Polar plot showing firing rate by HD for an HD cell. Firing rate (Hz) is represented in upper right corner for each example cell. Data in (A–C,E) are from Harvey et al. (2019).

