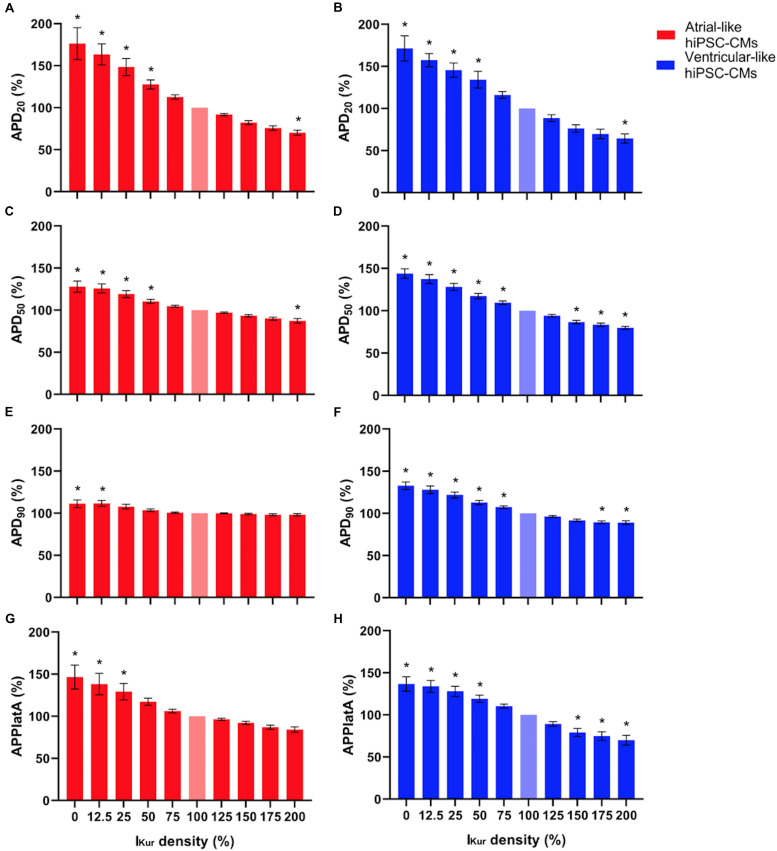
FIGURE 6.
(A,B) APD20, (C,D) APD50, (E,F) APD90, and (G,H) APPlatA of atrial- and ventricular-like hiPSC-CMs (left and right panels, respectively) at virtual IKur densities ranging from 0 to 200%. AP parameters are expressed as percentage relative to their value at 100% IKur density (bleached bars). Data from 11 atrial- and 10 ventricular-like hiPSC-CMs. *P < 0.05.

