Figure 5.
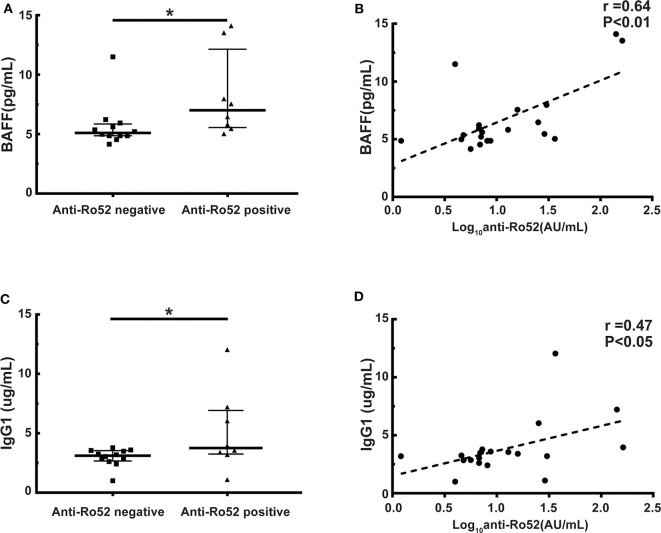
Anti-Ro52 levels are correlated with the levels of BAFF and IgG1. (A) BAFF levels in anti-Ro52-negative patients and anti-Ro52-positive patients. (B) Correlation between the levels of anti-Ro52 and the levels of BAFF in patient samples. (C) IgG1 levels in anti-Ro52-negative patients and anti-Ro52-positive patients. (D) Correlation between the levels of anti-Ro52 and the levels of IgG1 in patient samples. The black bars in each figure represent the 75th percentile, median and 25th percentile values. *P < 0.05. Anti-Ro52, anti-Ro52 autoantibodies; BAFF, B cell-activating factor.

