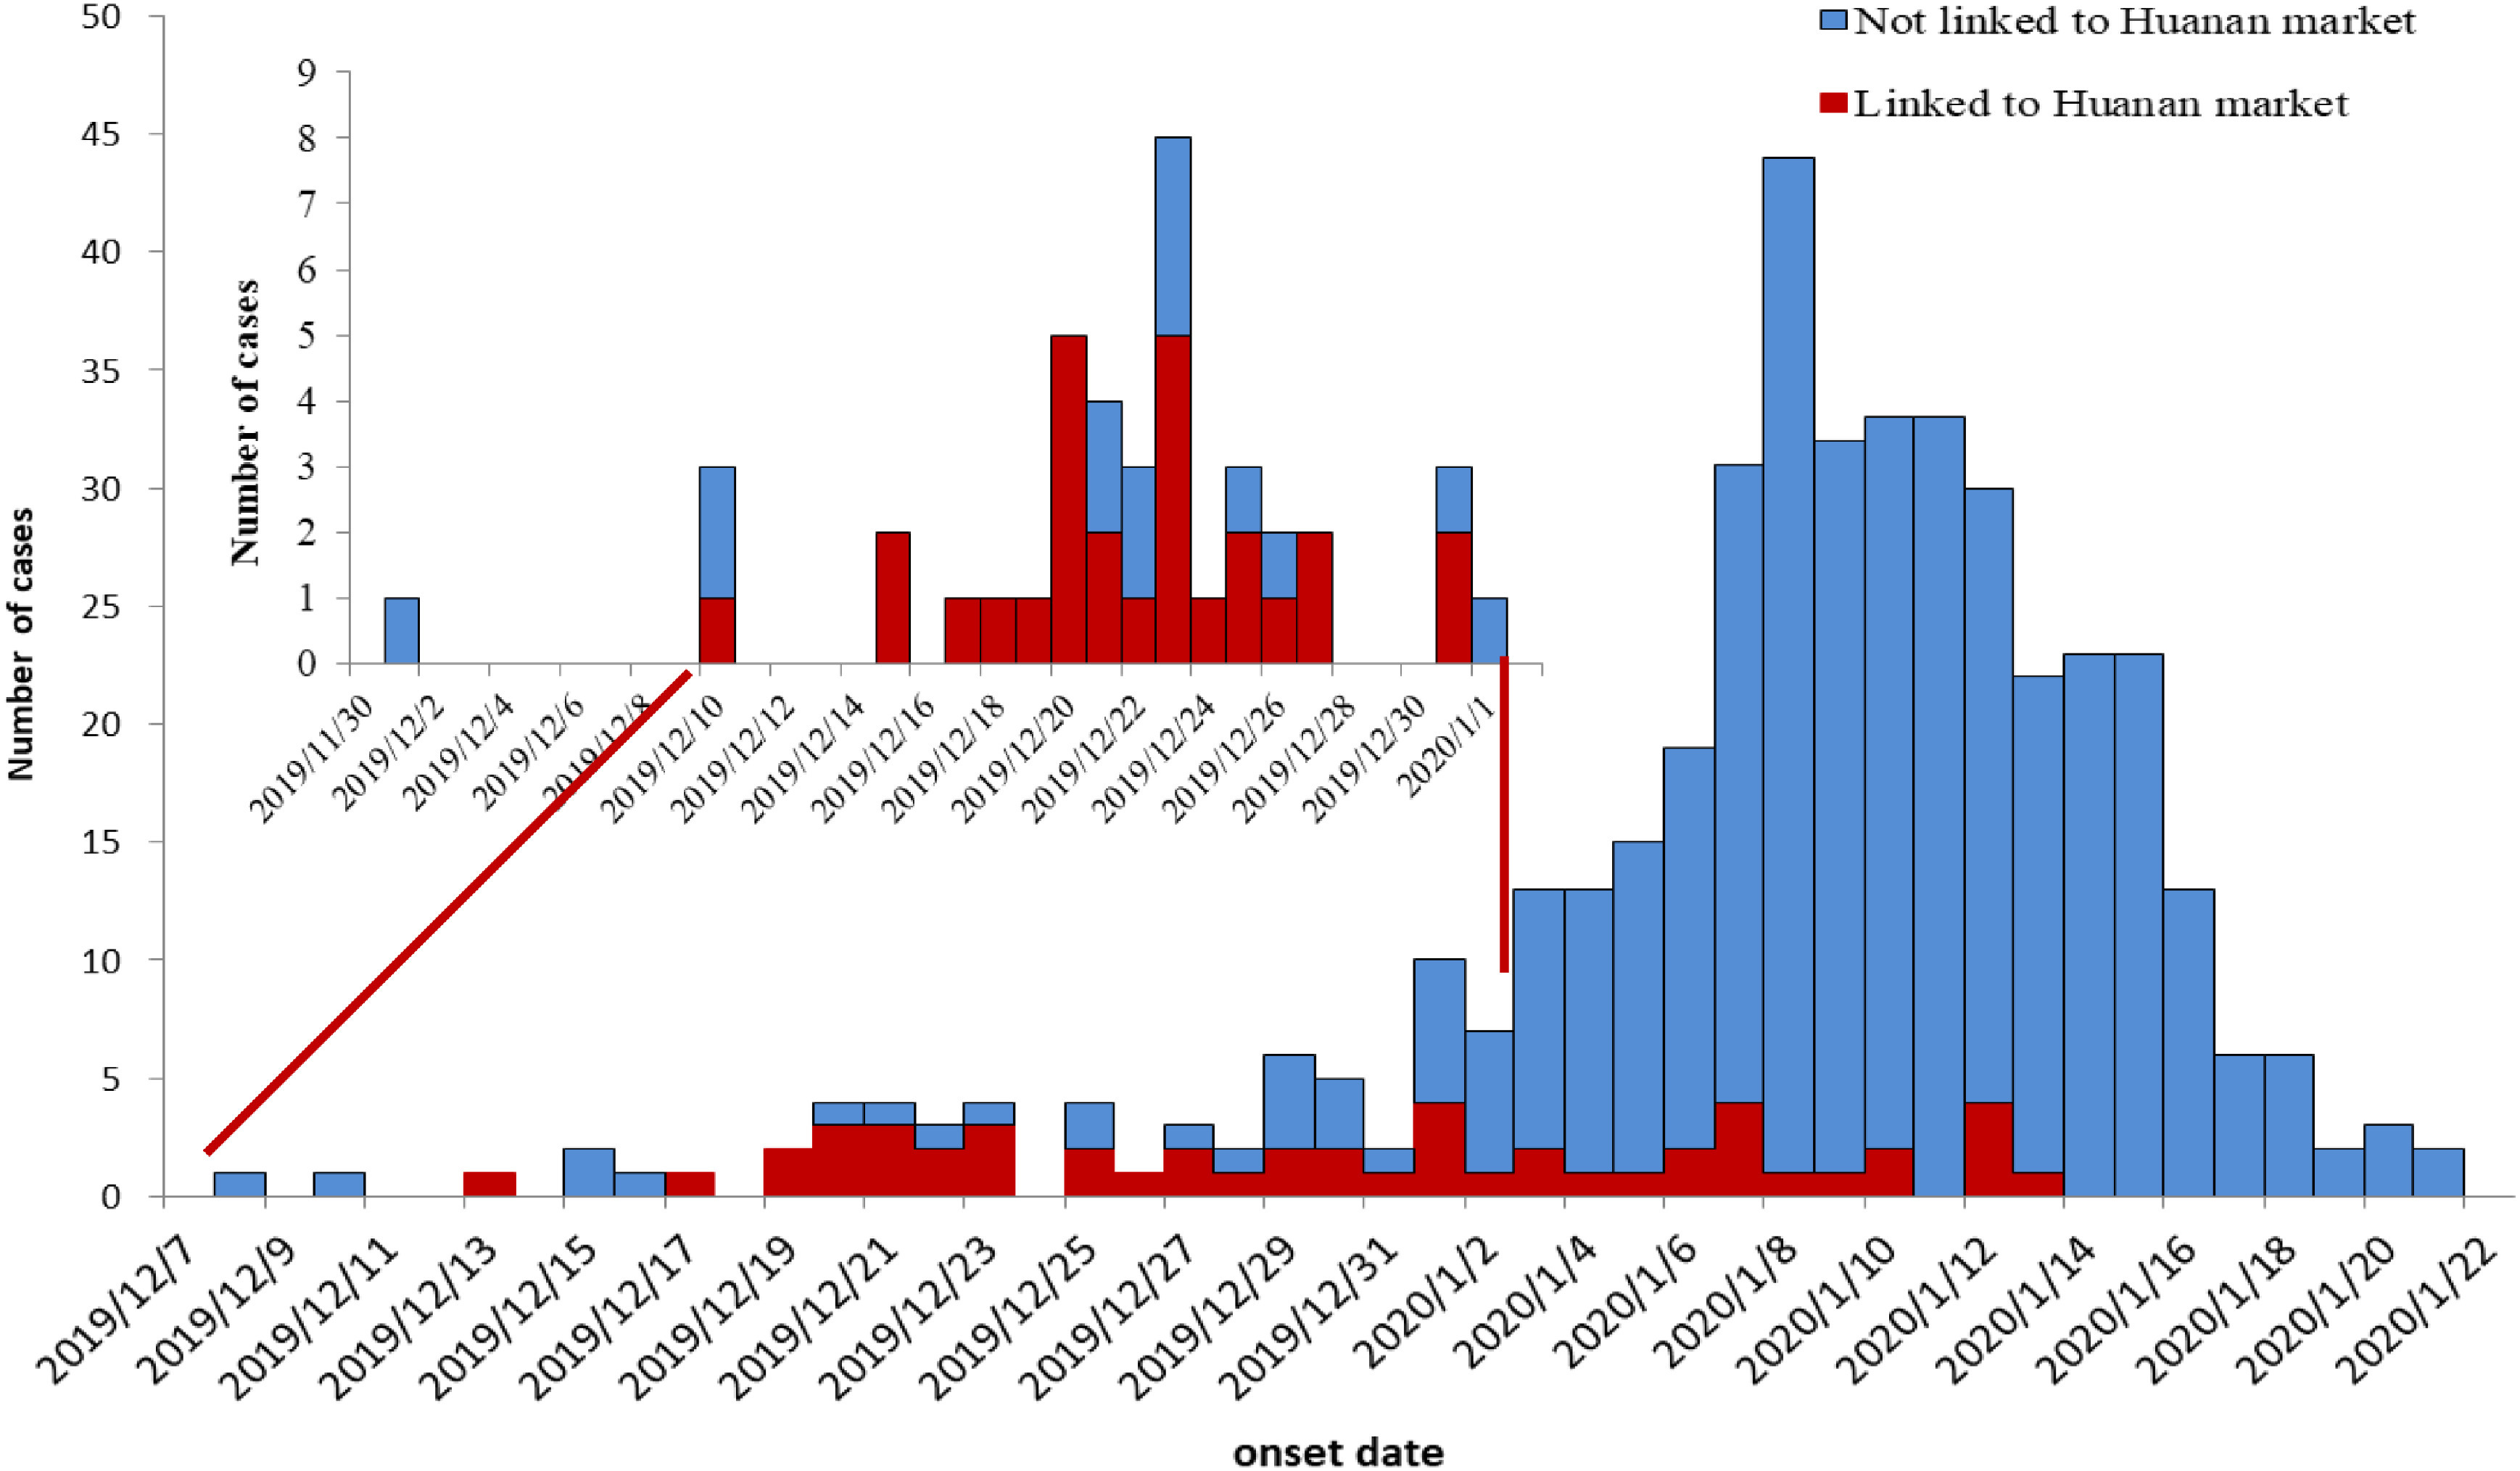
FIGURE 1.

Epidemiological Curve of COVID-19 Cases Reported by Timeline in Published Papers.3,4
Note: There is a difference in timing reported by Li et al.3 and Huang et al.,4 but both studies acknowledged that the epidemic started from mid-December, 2019. The data in the upper litter chart is from Huang et al.,4 and the data of the larger chart is from Li et al.3
