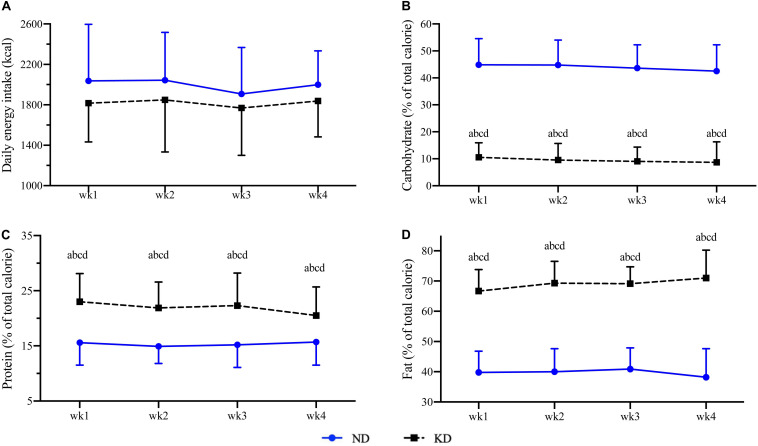
FIGURE 2.
Daily energy intake (A), proportions of carbohydrate (B), protein (C), and fat (D) intakes during normal diet (ND) and ketogenic diet (KD). Compared to week 1 of ND at a p < 0.01; compared to week 2 of ND at b p < 0.01; compared to week 3 of ND at c p < 0.01; compared to week 4 of ND at d p < 0.01.

