FIGURE 4.
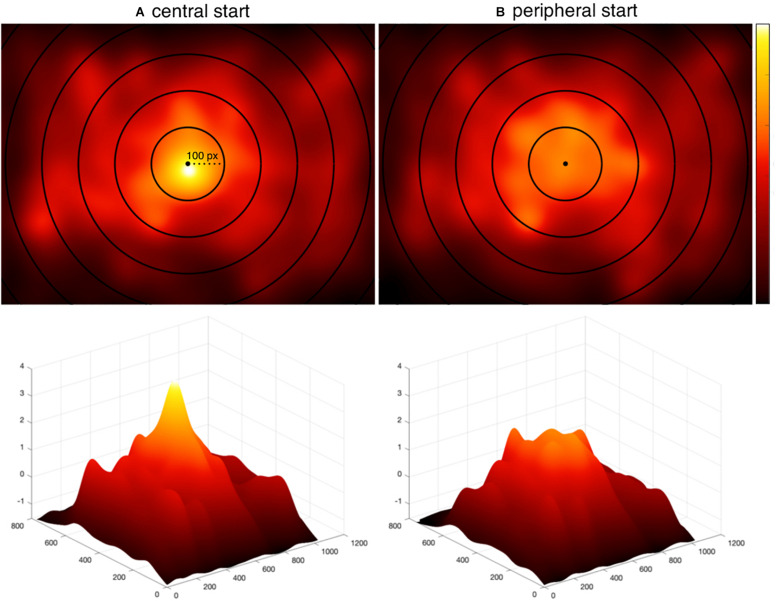
Fixation distributions. The distribution of all fixations aggregated across participants and scenes (A) from Peacock et al. (2019b) using a centrally located fixation cross, and (B) from the current experiment using a peripherally located fixation cross with delayed trial start. Concentric circles are overlaid on each map to show the extent of central bias. The most inner circle has a radius of 100 pixels and each circle increments the radius by 100 pixels. The second row visualizes the same heat maps in three dimensions. Heat maps are z-normalized to a common scale with black representing no fixations and white representing the highest density of fixations.

