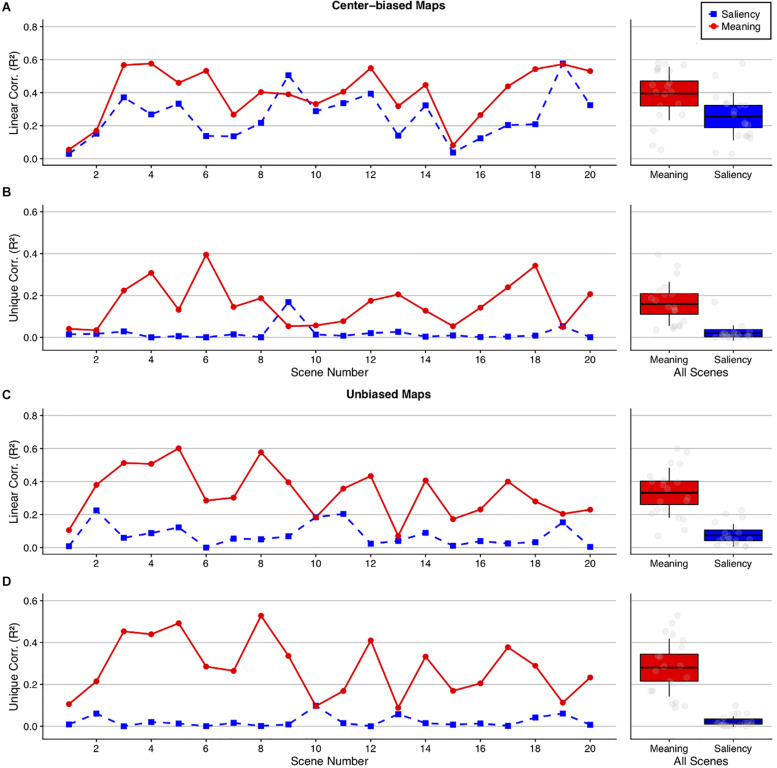
FIGURE 5.
Squared linear and semi-partial correlations by scene comparing meaning and image salience. Line plots show the (A,C) squared linear and (B,D) semi-partial correlations between the fixation density maps, meaning (red circles), and image salience (blue squares) using (A,B) center-biased and (C,D) unbiased prediction maps. The scatter plots show the grand mean (black horizontal line), 95% confidence intervals (colored boxes), and 1 standard deviation (black vertical line), for meaning and image salience across all 20 scenes for each analysis.

