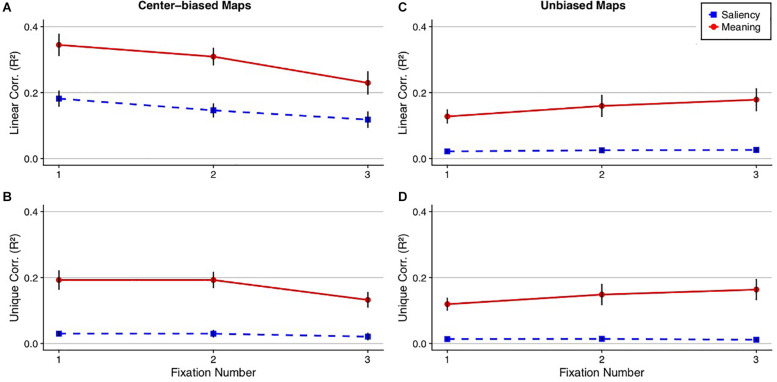
FIGURE 6.
Ordinal fixation analysis comparing meaning and image salience. The line plots show (A,C) the squared linear and (B,D) semi-partial correlations between the fixation density maps, meaning (red circle), and image salience (blue square) as a function of fixation number collapsed across scenes using the (A,B) center-biased and (C,D) unbiased prediction maps. Error bars represent the standard error of the mean.

