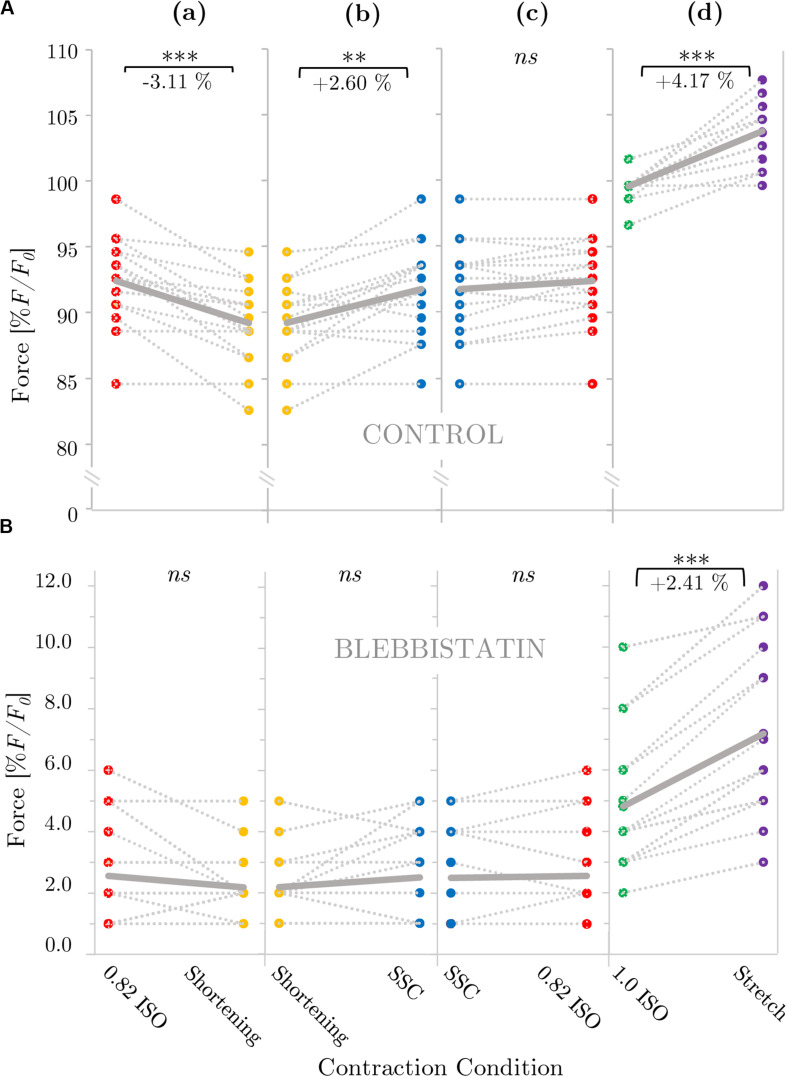
FIGURE 3.
Influence of varying ramp experiments on force for (A) control and (B) Blebbistatin experiments. The gray dotted lines of the scatterplots shown in panels (a–d) indicate the individual paired data values and gray solid lines indicate the mean values (n = 16 fibers from seven rats). Two fibers per animal (median) were examined, except for one animal from which one fiber was examined and three animals from which three fibers were examined. Mean forces are normalized to the forces obtained during actively isometric reference contractions at corresponding end lengths (0.82 L0 [0.82 ISO; red circles] for active shortening [yellow circles] and stretch-shortening [SSC; blue circles] conditions, respectively, and 1.0 L0 [1.0 ISO; green circles] for active stretch [purple circles] conditions). (B) Statistical analyses are based on muscle fiber experiments in the presence of Blebbistatin. Forces are calculated 28–33 s after the end of each ramp and they are expressed in percentage of maximum isometric force (% F/F0). Brackets and asterisks (*) mark differences in force after varying ramp conditions in the intergroup comparison. Significance levels are marked as follows: ∗p < 0.05, ∗∗p < 0.01, and ∗∗∗p < 0.001. ns means not significant.

