FIGURE 5.
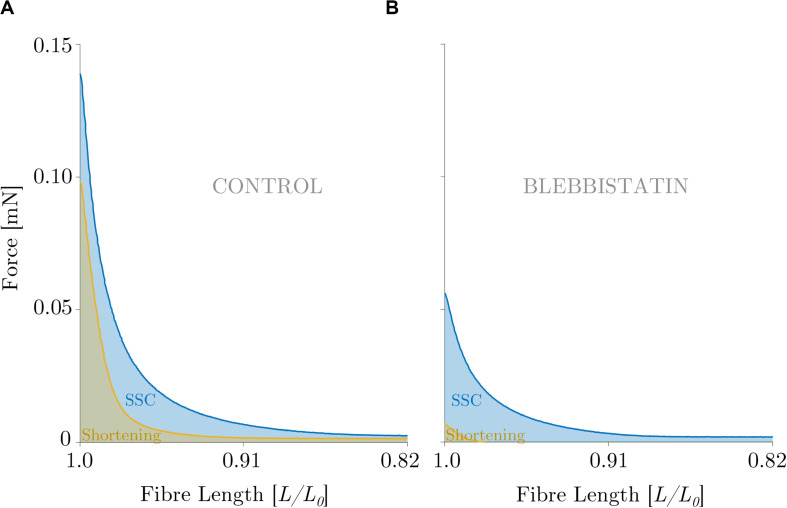
Direct visual comparison of mechanical work output obtained during the (A) control and the (B) Blebbistatin experiments. Representative force-length trace of a permeabilized single fiber segment from a rat soleus muscle (n = 1, raw data). Mechanical work was determined for a period of 450 ms during the shortening phase from the onset of release until the end of release using numerical integration of force with respect to length. The solid blue line indicates the shorting phase of the SSC, and the solid yellow line shows the active shortening condition. The blue and the brown shaded areas represent the line integrals for the SSC and shortening condition, respectively. The force is shown in mN and the fiber length is normalized to the optimum fiber length (L/L0). (A) The ‘CONTROL’ condition refers to the experiments without XB-inhibition, (B) ‘BLEBBISTATIN’ refers to the experiments with XB-inhibition.

