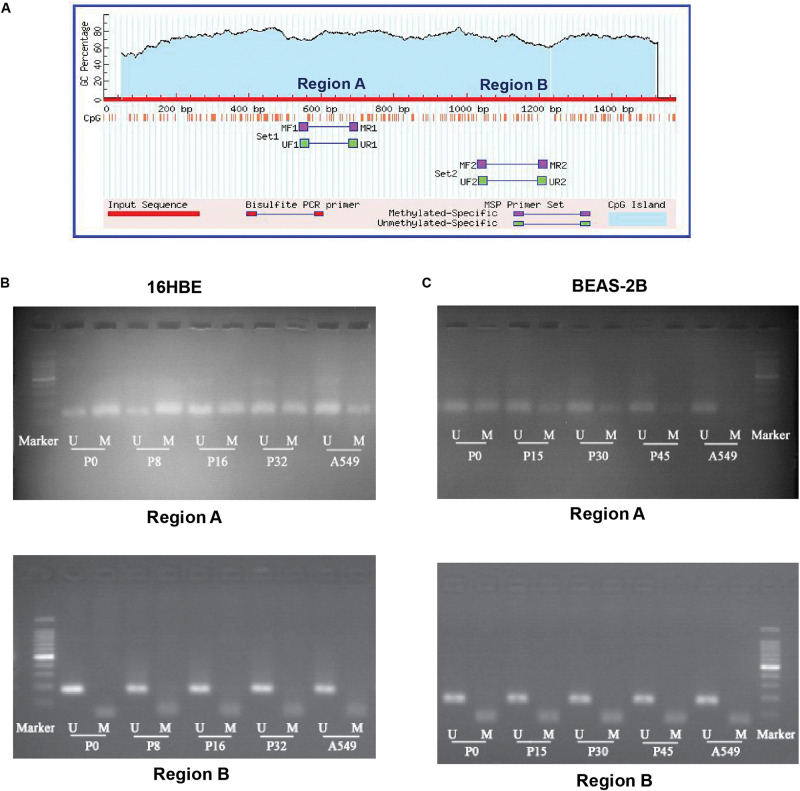
FIGURE 5.
MSP analysis of DNA methylation of the promoter of the NRF2 gene. (A) Schematic graph showing CpG islands in the NRF2 promoter region and binding sites for MSP PCR primers. (B,C) Representative electrophoresis results of PCR products of CpG islands in the NRF2 promoter region using primers illustrated in (A). M: methylated alleles. U: unmethylated alleles. A549 was used as a positive control.

