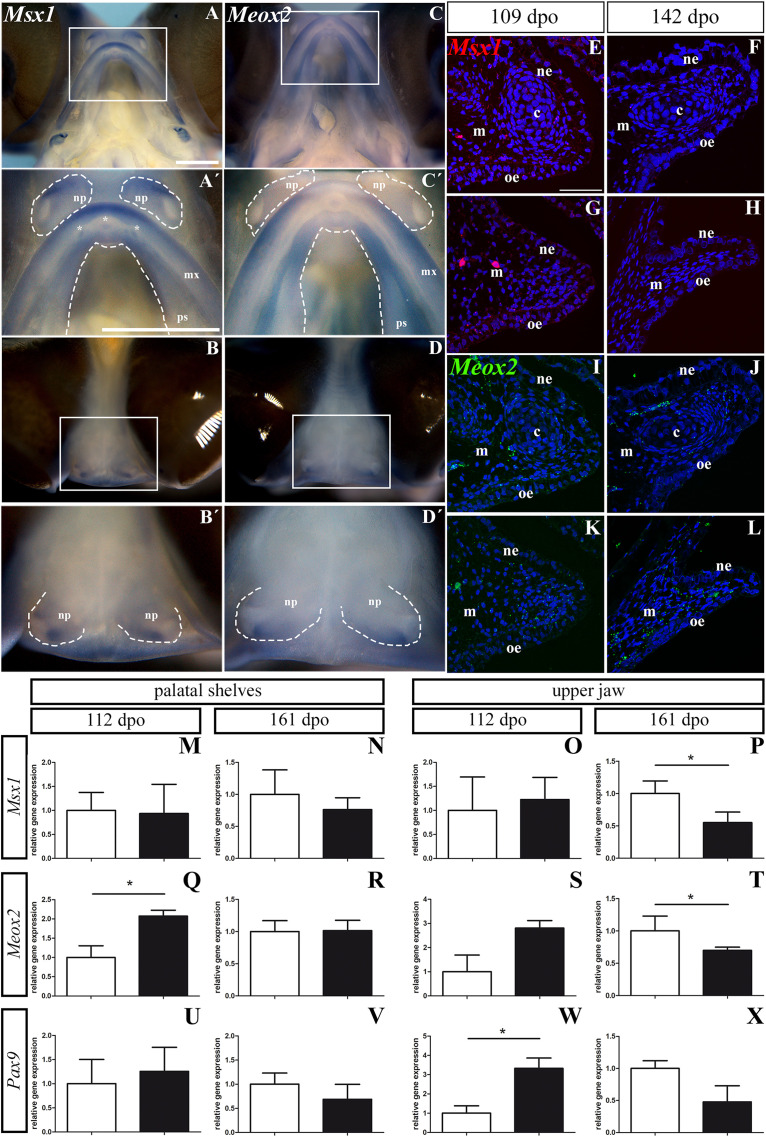
FIGURE 13.
Msx1, Meox2, and Pax9 expression during pre-hatching development of chameleon. Whole mount in situ hybridization analysis of Msx1 and Meox2 expression on embryo at stage 106 dpo (A–D′). Lower power pictures show overall view on expression of Msx1 and Meox2 in either ventral (A,C) or frontal (B,D) view. Higher power pictures display detail of Msx1 and Meox2 expression in the upper jaw region, palatal shelves and nasal pits, from ventral (A′,C′) and frontal (B′,D′) view. White rectangles define detailed area. The palatal shelves and nasal pits are highlighted with dashed line. Asterisks show expression of Msx1 in developing teeth. np, nasal pit; mx, maxilla; ps, palatal shelf. Scale bars: 1 mm. RNAScope analysis of Msx1 and Meox2 expression (E–L). Transversal sections with focus on the palatal shelves at 109 dpo (E,G,I,K) and 142 dpo (F,H,J,L) in rostral and caudal regions. Specific expression of Msx1 in rostral (E,F) and caudal (G,H) region is shown as red dots. Meox2 expression in rostral (I,J) and in caudal (K,L) regions is shown as green dots. Nuclei are counterstained with DAPI. ne, nasal epithelium; oe, oral epithelium; m, mesenchyme; c, cartilage. Scale bar: 50 μm. QPCR analysis of Msx1, Meox2, and Pax9 expression (M–X). Comparison of relative gene expression of Msx1, Meox2, and Pax9 in the palatal shelves at earlier (112 dpo; M,Q,U) and later stage (161 dpo; N,R,V), and in the upper jaw at 112 dpo (O,S,W) and 161 dpo stage (P,T,X), respectively. Gene expression is compared to the rostral region (white columns) and its gene expression level is displayed as value 1.0. The expression in the caudal region (black columns) is displayed as fold change to rostral area. t-test; p * < 0.05.

