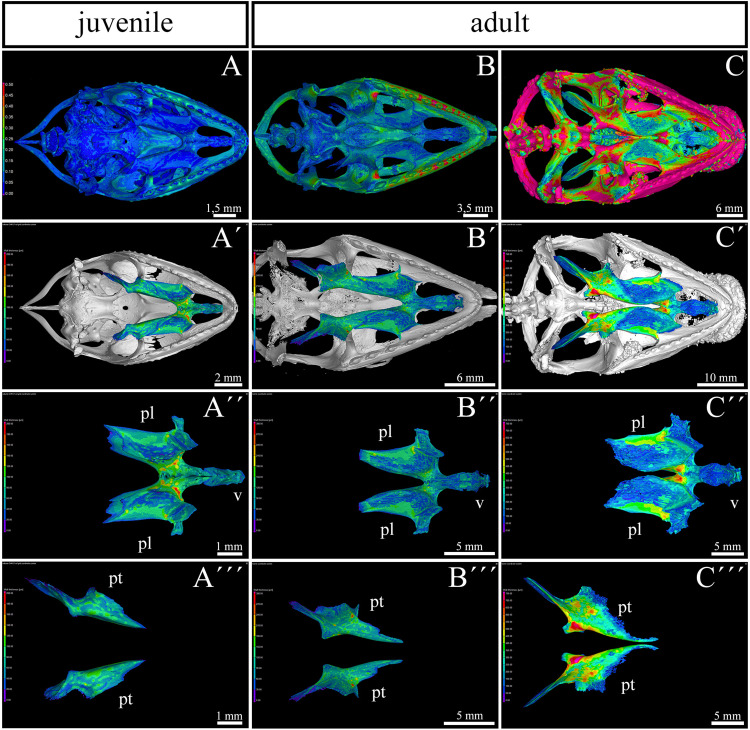
FIGURE 3.
Bone thickness skeletal analysis of individual bones at the post-hatching stages of chameleon by microCT. Bone thickness analysis of juvenile and two adult animals with palatal view on the skull. Same scales were used to reveal differences in ossification progress of individual skeletal elements with the age of animal (A–C). Whole mount cranial skeleton from palatal view displays segmentation of the main palate-forming bones (A′–C′). Detailed segmentation of the palatine bones and vomer in juvenile (A″), younger adult (B″) and older adult (C″) chameleons. Individually segmented pterygoid bones are shown on (A″′) for juvenile, (B″′) for younger adult, and (C″′) for older adult. Notice that scales in the wall thickness analysis of individual bones (A′–C″′) were set individually for each sample in order to describe the minute differences in bone thickness inside of individual skeletal elements. The main reason for setting the scales individually was that the images with unified scale lost some important detail in juvenile or in older adult. Bone thickness is displayed by a different colors from blue (the thinnest, 0 μm) to red (the thickest, up to 200 μm) demonstrated in colors legend. pl, palatine bone; pt, pterygoid bone; v, vomer. Scale bars are displayed individually for each picture.

