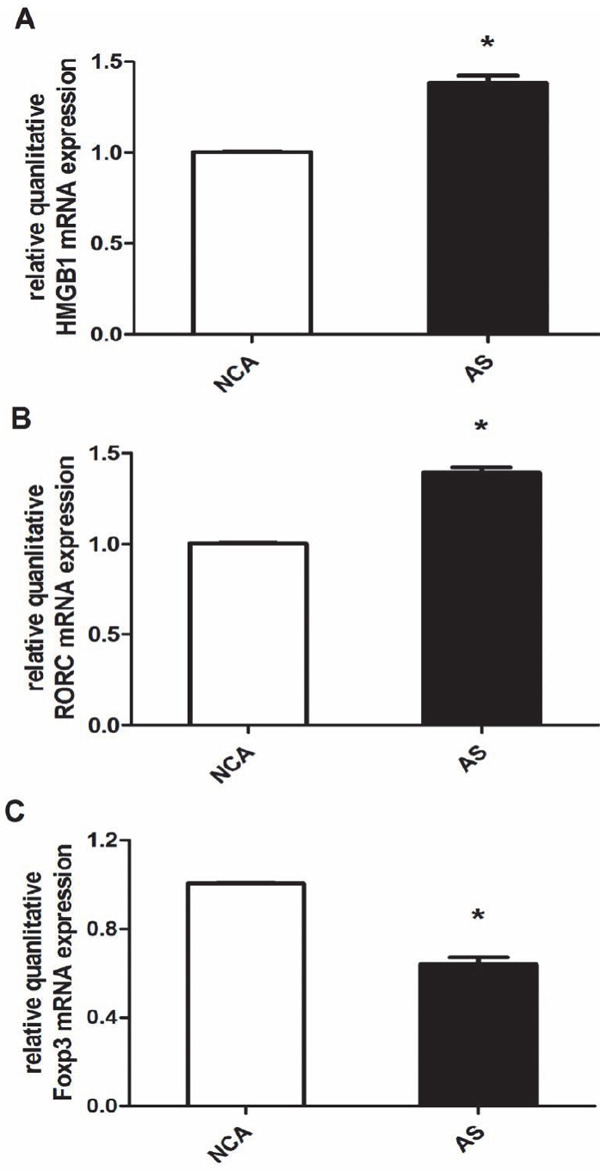
Fig. 2.

The expression of HMGB1, RORC, and Foxp3 mRNA in PBMC. (A) The relative quanlitative HMGB1 mRNA expression were compared between two groups [coronary atherosclerosis (AS); normal coronary arteries (NCA)]; (B) The relative quanlitative RORC mRNA expressions were compared between the two groups; (C) The relative quanlitative Foxp3 mRNA expressions were compared between the two groups; *P < 0.01 is considered statistically significant.
