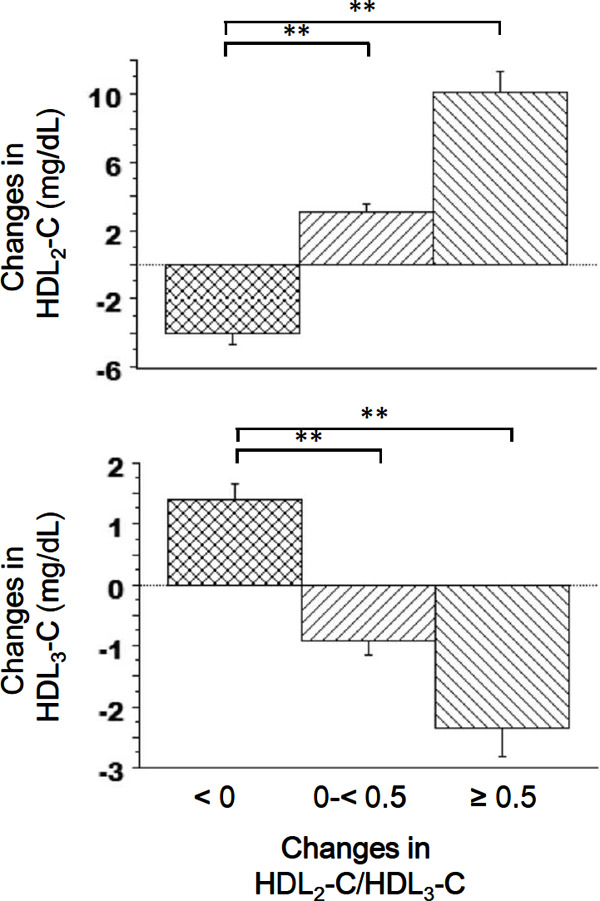
Fig. 1.

Changes in the mean HDL2-C and HDL3-C values stratified by changes in the HDL2-C/HDL3-C ratio. Error bars represent 95% confidence intervals. **P < 0.01 (Dunnett's multiple comparisons test).
HDL2-C, high-density lipoprotein 2 cholesterol; HDL3-C, high-density lipoprotein 3 cholesterol.
