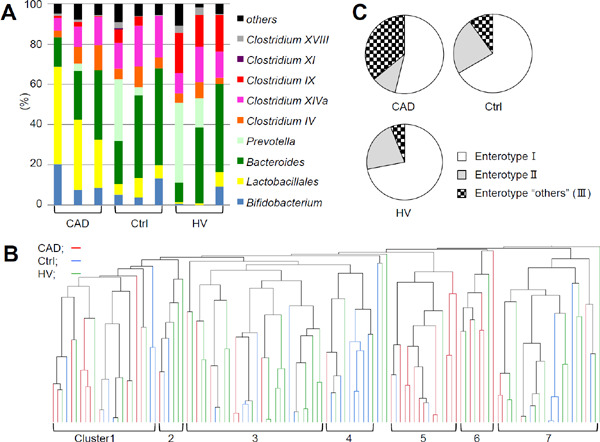
Fig. 1.

Distribution of gut microbiota and classification of enterotype in the coronary artery disease (CAD), control, and healthy volunteer groups (A) Representative profiles of gut microbiota. (B) Dendrogram of the similarity was shown. (C) Enterotype “others” (III) was enriched in CAD group (p < 0.001, chi-squared test). The terminal restriction fragment length polymorphism patterns were analyzed using Pearson's correlation and the unweighted pair-group method with arithmetic mean algorithm. Enterotypes were defined as follows: I, > 30% Bacteroides; II, > 15% Prevotella; and the remaining as “others” (III).
