
Fig. 2.
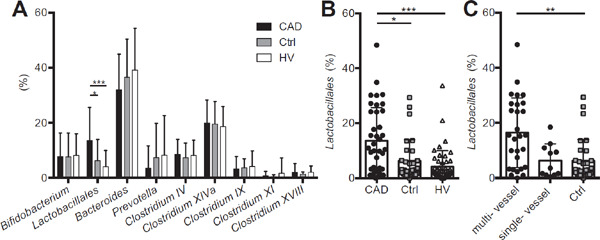
Comparison of the order Lactobacillales. (A) The percentage of each group of gut microbiota was compared among the coronary artery disease (CAD), control (Ctrl), and healthy volunteer (HV) groups. The percentage of the order Lactobacillales was increased (B) in the CAD group (CAD, Ctrl vs. HV) (C) especially in CAD patients with multi-vessel disease (multiand single-vessel disease vs. Ctrl). Closed circles indicate the CAD group; gray squares indicate the Ctrl group, whereas open triangles indicate the HV group. Single- or multi-vessel disease referred to the number of major coronary vessels demonstrating > 75% stenosis on diagnostic coronary angiography. Kruskal–Wallis test followed by Dunn's post-hoc analysis was used to calculate p-values (*p < 0.05, **p < 0.01, and ***p < 0.001).