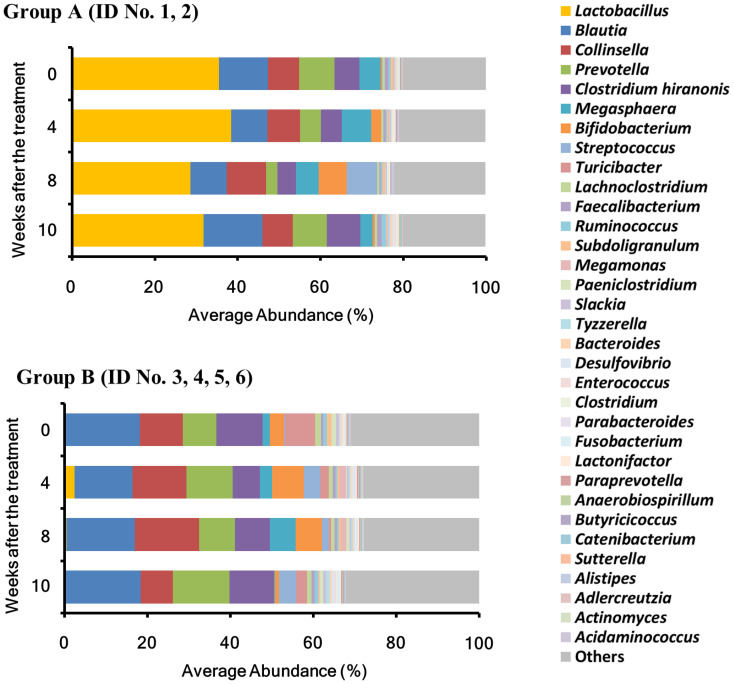
Fig. 1.
Intestinal microbiota composition analysis at the genus level. The mean abundance of the top 34 taxa, with values of 0.1% or higher during the study period, in all samples at each time point (0, 4, 8, and 10 weeks). The group in which the abundance of the genus Lactobacillus at the study initiation was the highest was designated as Group A (GA) and the group in which the abundance of the genus Blautia was the highest with few Lactobacillus was designated as Group B (GB).

