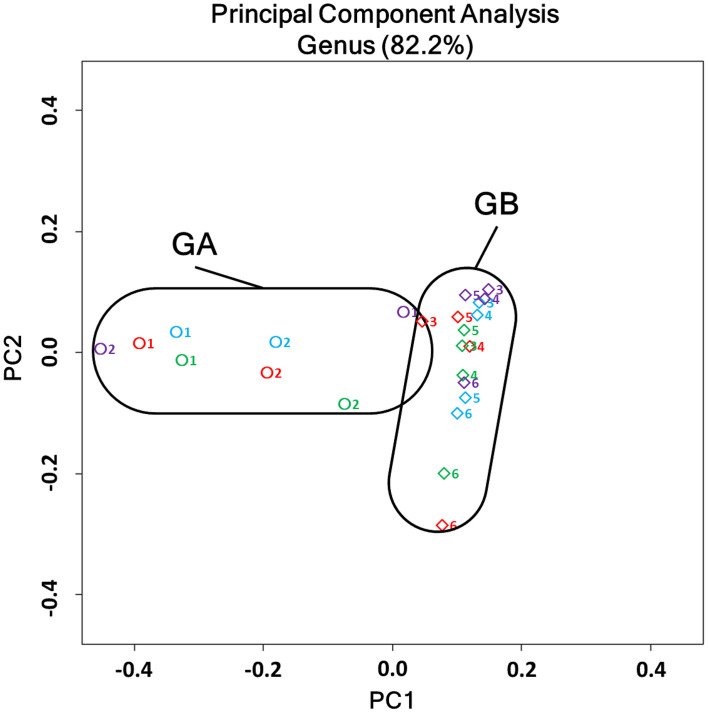
Fig. 2.
Two-dimensional PCoA analysis of microbiota in all samples. A plot of the first primary component (PC1) on the horizontal axis and the second primary component (PC2) on the vertical axis, and each plot represents the microbiota structure of individual samples. Plots were differently colored as follows: 0 weeks, blue; 4 weeks, red; 8 weeks, green; and 10 weeks, purple. The number (1–6) beside the symbol indicates the ID numbers of cats. Circles and diamonds represent Group A (GA) and Group B (GB) samples, respectively.

