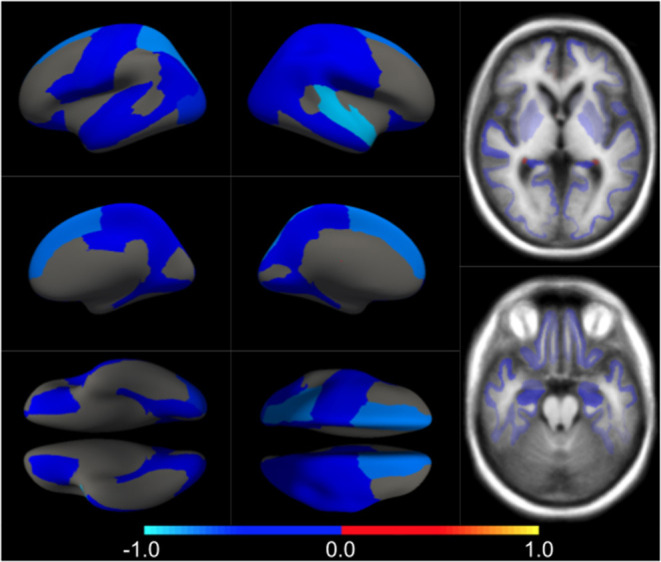
Figure 1.

Different views of the multivariate brain morphometric effect of age (type vcAD). For visualization purposes, we have scaled the effect-type in the range [−1, 1] and masked all regions below a certain threshold (20% of the maximum value). The color-code represents negative (blue) and positive (red) relative contributions of each brain ROI to explaining the variability of confounders (age and sex).
