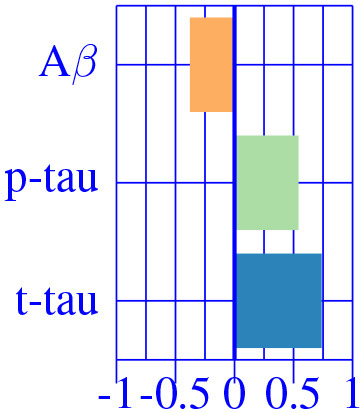
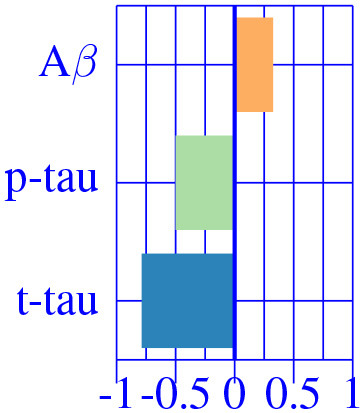
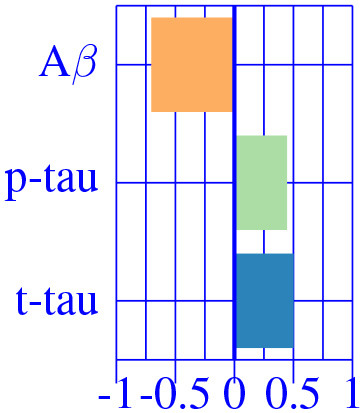
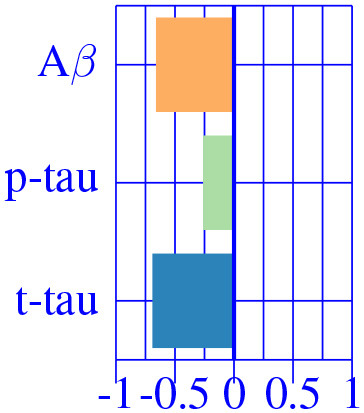
Table 2.
Multivariate CSF effects on brain morphology for different diagnostic categories.
| Centroid 0 | Centroid 1 | Centroid 2 | Centroid 3 | |
|---|---|---|---|---|
 |
 |
 |
 |
|
| ADc | Pallidum R | Precuneus R | Cuneus L | Choroid Plexus R |
| Pallidum L | Precuneus L | Pericalcarine R | Choroid Plexus L | |
| Precentral L | Amygdala R | Caudate R | ||
| Precentral R | Amygdala L | Caudate L | ||
| Lateral Orbitofrontal L | Bankssts R | Paracentral R | ||
| Lateral Orbitofrontal R | Bankssts L | Post-central R | ||
| Frontal Pole L | Entorhinal R | Medial Orbitofront. L | ||
| Frontal Pole R | Entorhinal L | |||
| Superior Temporal R | Fusiform R | |||
| Supramarginal R | Fusiform L | |||
| Caudal Ant. Cingulate R | Hippocampus R | |||
| Medial Orbitofrontal R | Hippocampus L | |||
| ParsOrbitalis L | Inferior Temporal R | |||
| Pericalcarine L | Inferior Temporal L | |||
| Temporal Pole L | Middle Temporal R | |||
| Transverse Temporal L | Middle Temporal L | |||
| Insula L | Inferior Parietal R | |||
| ParsOpercularis R | Inferior Parietal L |
Statistical significant ROIs are grouped in 4 clusters characterized by their centroid. We refer to all centroids as the latent pathological patterns driving morphological changes and are shown in the header of the table.
