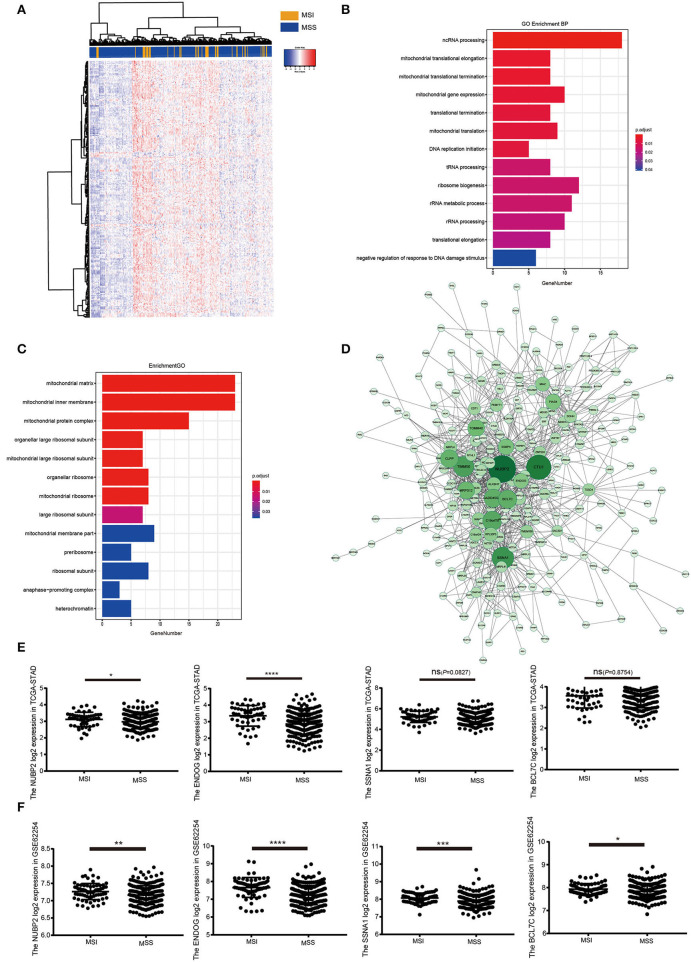
Figure 4.
GO enrichment for the pink module and identification of the hub genes. (A) Heatmap for the expression pattern of all genes in pink module at MSI and MSS phenotype. (B,C) The biological process and cellular component for the pink module in GO annotations. (D) The coexpression network for the genes in pink module and identification of the hub genes. (E) The expression of NUBP2, ENDOG, SSNA1 and BCL7C that had been log2 normalized in TCGA-STAD dataset in MSI (N = 51) and MSS group (N = 264). (F) The validation of NUBP2, ENDOG, SSNA1 and BCL7C expression that had been log2 normalized in GSE62254/ACRG in MSI (N = 68) and MSS group (N = 232). *P < 0.05, **P < 0.01, ***P < 0.001, ****P < 0.0001.

