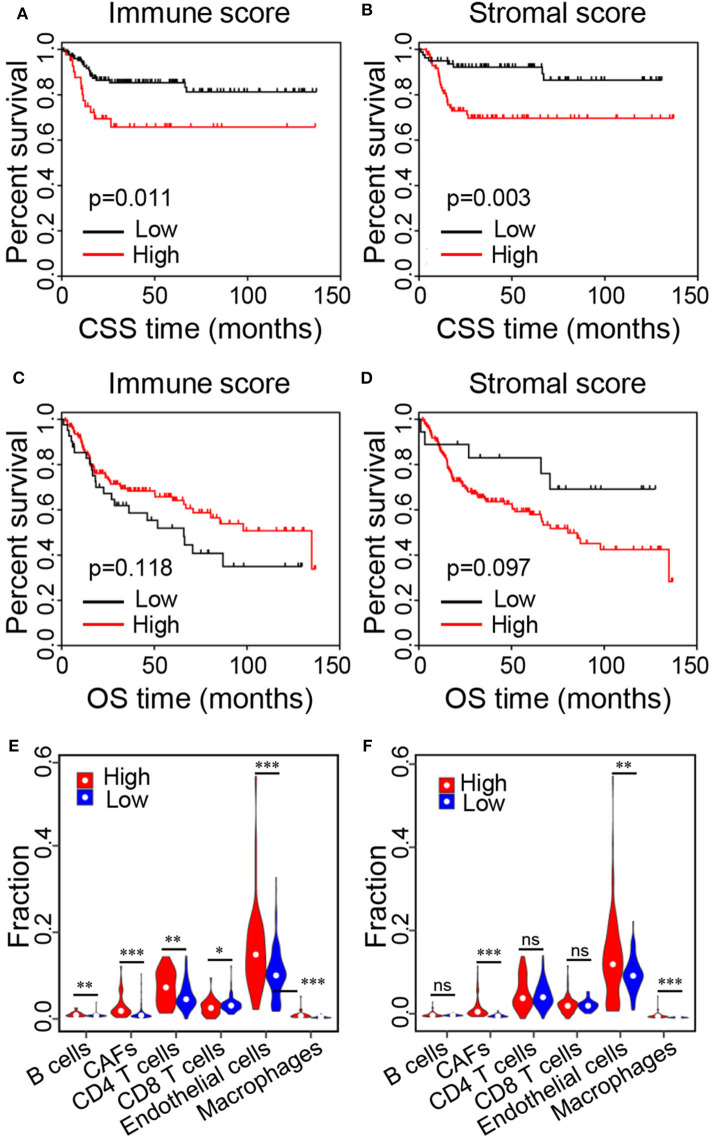
Figure 2.
Kaplan–Meier survival curves of BC patients and relative proportions of immune cells in the high and low score groups. (A,B) Kaplan–Meier curves of CSS for patients with low vs. high immune and stromal scores. (C,D) Kaplan–Meier curves of OS for patients with low vs. high immune and stromal scores. (D–F) Relative proportions of immune cells in the low vs. high immune and stromal score groups (*p < 0.05, **p < 0.01, ***p < 0.001, ns, no significance). CSS, cancer-specific survival; OS, overall survival.

