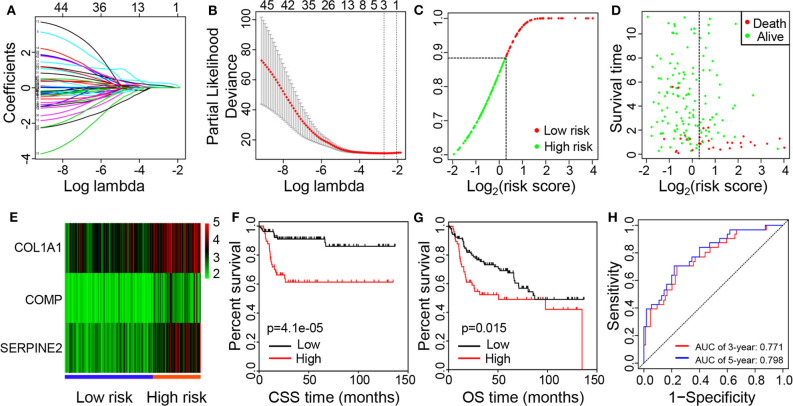
Figure 4.
Identification of prognostic genes and establishment of the risk prediction model. (A) LASSO coefficient profiles of the 45 significant genes from the result of the univariate regression. (B) Feature selection for prognostic biomarkers using the LASSO method. (C) Distributions of risk score. (D) The survival time of patients in high- and low-risk groups. (E) Heat map of expression levels of the three prognostic genes in the high- and low-risk groups. (F) Kaplan–Meier curves of CSS for patients with low vs. high risk scores. (G) Kaplan–Meier curves of OS for patients with low vs. high risk scores. (H) ROC curves of the risk model for predicting 3- and 5-year survival rates. LASSO, Least Absolute Shrinkage and Selector Operation; CSS, cancer-specific survival; OS, overall survival; ROC, receiver operating characteristic.

