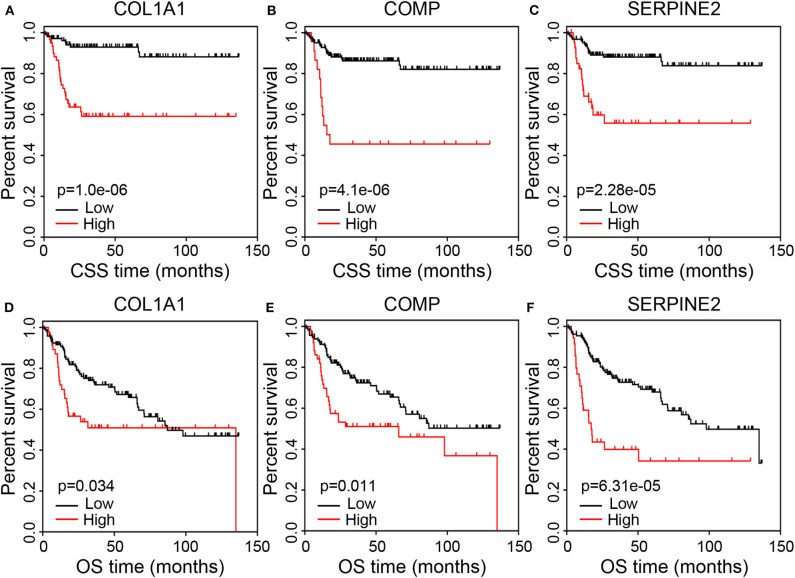
Figure 5.
Correlation of the prognostic genes with survival of BC patients. (A–C) Kaplan–Meier curves of CSS for patients grouped by expression levels of COL1A1, COMP, and SERPINE2. (D–F) Kaplan–Meier curves of OS for patients grouped by expression levels of COL1A1, COMP, and SERPINE2. BC, bladder cancer; CSS, cancer-specific survival; OS, overall survival.

