Figure 1.
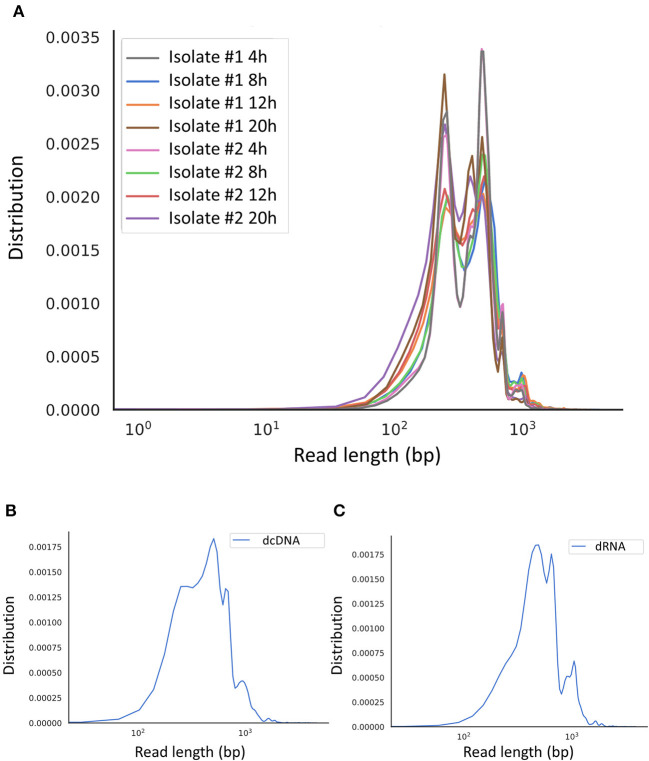
Aligned read length distribution. Line chart presentation of the average of aligned read lengths obtained via Nanopore sequencing. (A) Amplified cDNA sequencing at various time points. (B) Direct cDNA sequencing and (C) direct RNA sequencing using samples from multiple time points after the infection.

