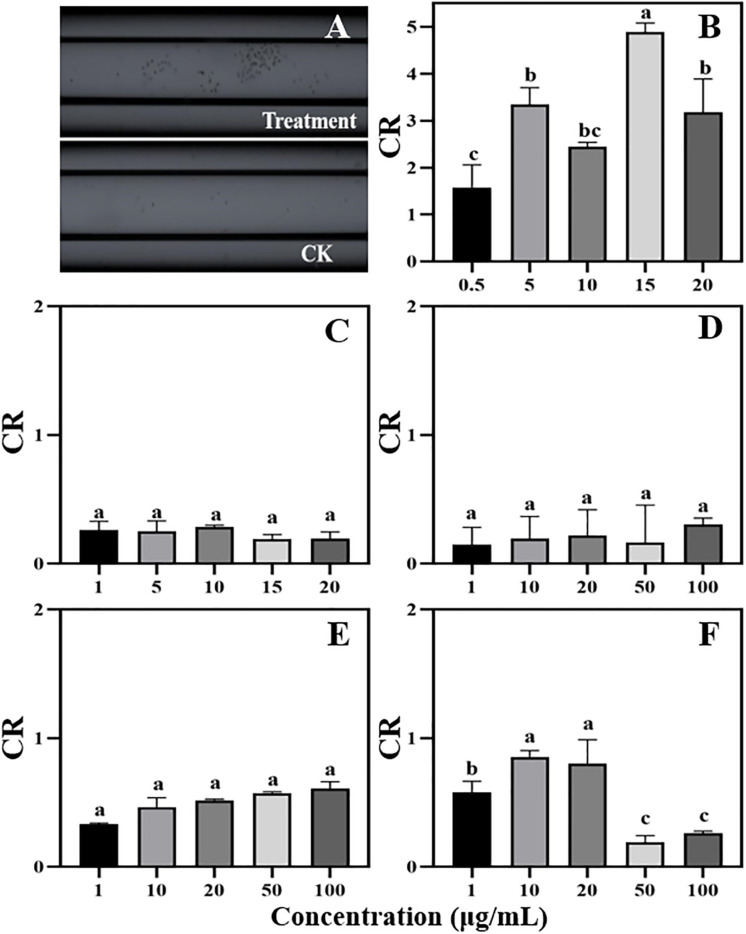
FIGURE 4.
Chemotaxis of zoospores to different concentrations of phenolic acids. (A) Chemotaxis picture (treatment: 5 μg/mL cinnamic acid; CK: 1%MeOH-H2O); (B) Cinnamic acid (Concentration: 0.5–20 μg/mL); (C) p-Coumaric acid (Concentration: 1–20 μg/mL); (D–F) Vanillic acid, ferulic acid, and p-Hydroxybenzoic acid (Concentration: 1–100 μg/mL). Significant differences are based on ANOVA test (P < 0.05). The error bars indicate the standard errors of the means (n = 3).

