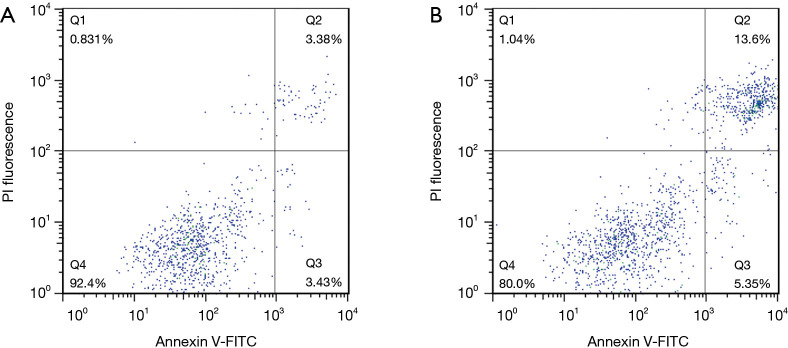
Figure 7.
Differences in apoptosis levels between the control and shFRAT2-1 groups of T47D cells. (A) The percentage of T47D control group cells in Q2 was 3.38%, and in Q3, it was 3.34%. The sum of the cells in Q2 and Q3 was 6.81%. (B) Of the shFRAT2-1 transfected T47D cells, 13.6% were in Q2, while 5.35% were in Q3. The sum of the cells in Q2 and Q3 was 18.95%. FITC, fluorescein isothiocyanate; FRAT2, frequently rearranged in advanced T-cell lymphomas 2.

