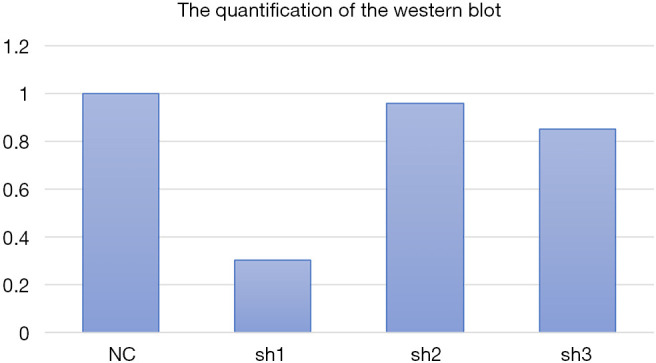
Figure S1.

The quantification of Western Blotting. We analyzed the gray values of the WB results. We set NC as a standard, the relative values of three constructed shRNA were shown in the figure. The shRNA-1 had the most significant effect on knocking down, which was consistent to the results of mRNA expression. WB, western blotting.
