Figure 3.
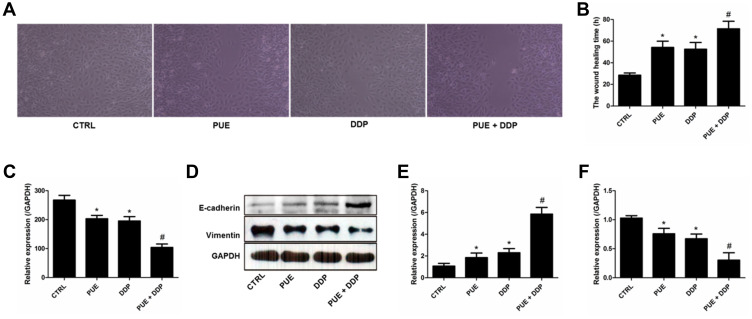
Migration of A549/DDP cells inhibited by various treatments and investigation of the underlying molecular mechanism. (A) Wound healing images after scratch incubation with drug-free medium (Control group), PUE (120 μg/mL), DDP (40 μg/mL), and PUE and DDP (120 μg/mL+40 μg/mL). (B) Quantitative analysis of the inhibition effect of various formulations on the migration of A549/DDP cells. (C) Determination of the levels of VEGF in A549/DDP cells after different treatment strategies by ELISA assay. (D) Qualitative evaluation of the levels of E-cadherin and Vimentin in A549/DDP cells after different treatment strategies by Western blot experiments. (E) Quantitative analysis of the expression of E-cadherin post various treatments. (F) Quantitative analysis of the expression of Vimentin post various treatments. *p < 0.05, compared with controls. #p < 0.05 compared with the cells only treated by DDP.

