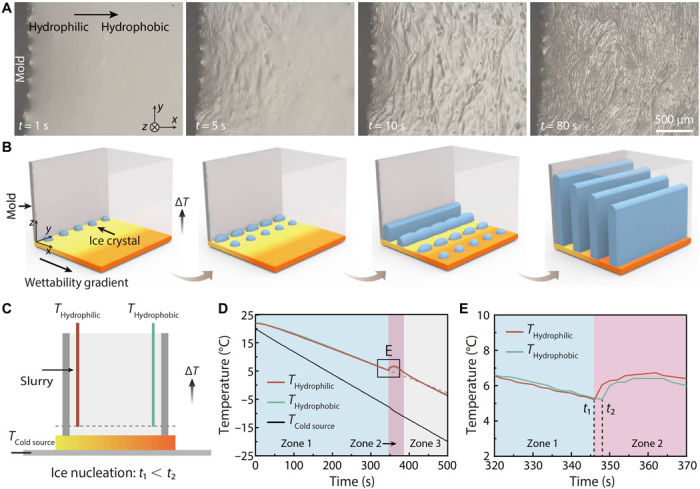
Fig. 2. Observation of the freezing process.

(A) Top-view optical images showing successive nucleation of ice crystals from the hydrophilic to hydrophobic region and oriented growth perpendicular to the wettability gradient. (B) Schematic illustration of the freezing process showing successive nucleation and preferential growth. (C) Schematic illustration of thermocouples recording temperature variation above the hydrophilic and hydrophobic regions of the gradient surface. (D) Temperature variation of three zones over time. (E) Enlarged from (D) showing ice nucleation starts faster on the hydrophilic region.
