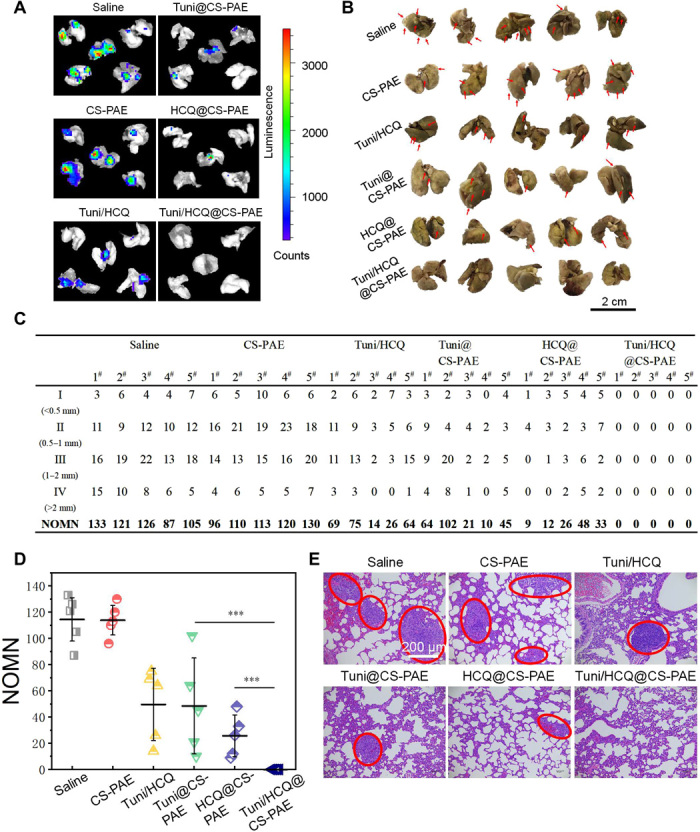
Fig. 5. In vivo antitumor metastasis.

(A) Bioluminescence images of tumor lung metastases in each treatment group in vitro. (B) Photographs of lung tissues; tumor metastasis was visualized by Bouin’s fixative, and metastatic nodules were white (represented by red arrows). (C and D) Counting the number of lung metastasis nodules, measurement of the diameter of metastatic tumors, and performing classification and counting. Number of metastasis nodes (NOMN) = I × 1 + II × 2 + III × 3 + IV × 4 (according to the diameter of the lung nodules for class 4: I < 0.5 mm, 0.5 mm ≤ II < 1 mm, 1 mm ≤ III ≤ 2 mm, and IV > 2 mm). (E) H&E staining of lung tissue after the various treatments. The red circle marks the metastatic tumor tissue. [Photo credit for (A), (B), and (E): Funeng Xu, Southwest Jiaotong University].
