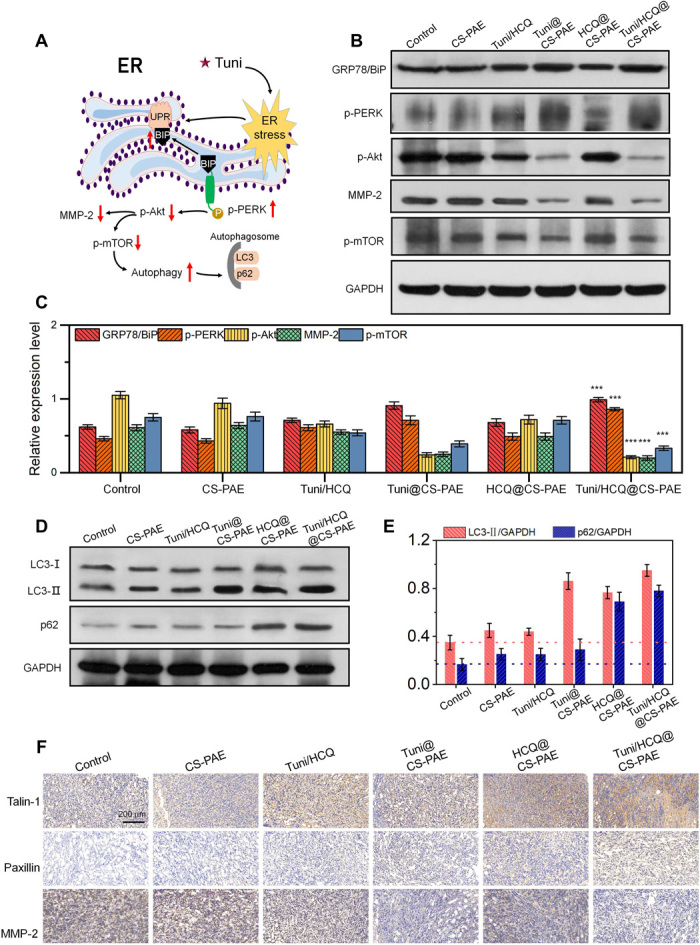
Fig. 6. Intrinsic signal pathways analysis.

(A) Schematic diagram of Tuni causing ER stress, promoting autophagy, and reducing MMP-2 expression via signaling pathways in vivo. (B) WB analysis of key proteins of ER stress and downstream pathway protein of 4T1 tumor in BALB/c mice. (C) Relative expression level of key proteins in (B); ***P < 0.001 compared with control. (D) Expression of LC3 and p62 lanes of 4T1 tumor in BALB/c mice via WB. (E) Quantification of the ratio of LC3-II to glyceraldehyde-3-phosphate dehydrogenase (GAPDH) and p62 to GAPDH expression using ImageJ software. (F) IHC pictures of talin-1, paxillin, and MMP-2 in 4T1 tumor–bearing BALB/c mice.
