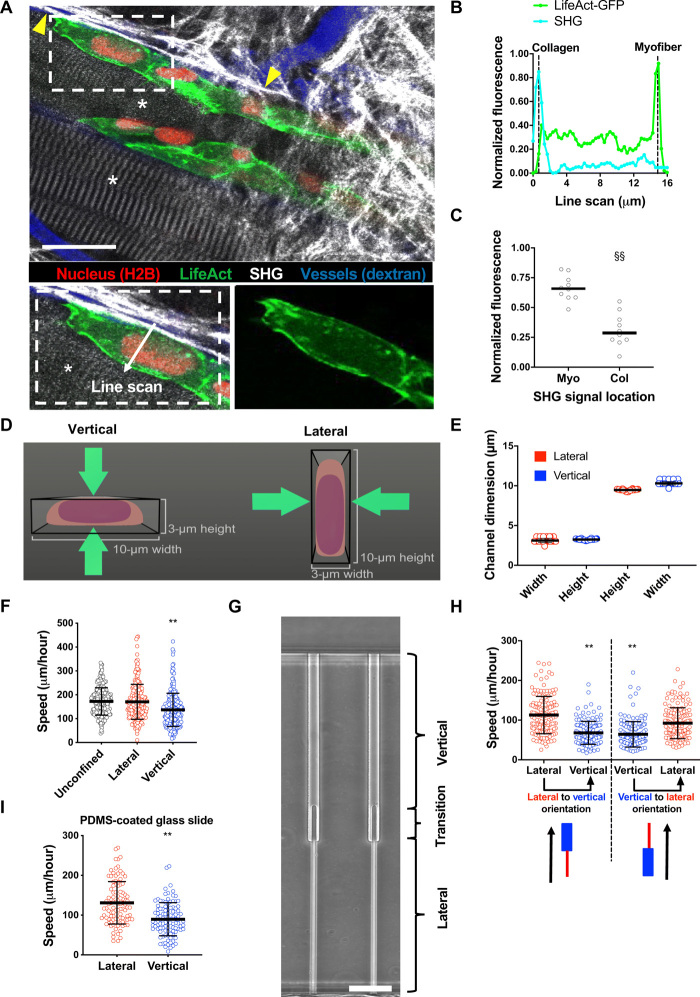
Fig. 1. Cells migrate with different efficiencies through vertically and laterally confined microchannels.
(A) Polarization of actin in HT-1080/LifeAct-GFP/H2B-mCherry fibrosarcoma cell invading the deep dermis along myofiber and fibrillar collagen-rich tissue structures. Images represent overview and detail obtained by multicolor multiphoton time-lapse microscopy 5 days after tumor implantation. Arrowheads, second harmonic generation (SHG)–positive collagen fibers. Asterisks, SHG-positive myofibers. Scale bar, 25 μm. (B) Normalized fluorescence intensities of LifeAct-GFP and SHG along the indicated line scan arrow from a representative cell. (C) Comparison of LifeAct-GFP peak intensities in individual cells relative to the position of myofiber (Myo) and collagen (Col) SHG signals (n = 10 cells; three mice). (D) Schematic representation of a cross-sectional view of vertical and lateral microchannels. (E) Dimensions of vertical and lateral channels, as measured by a profilometer (n = 40 channels). (F) Migration speeds of HT-1080 fibrosarcoma cells in lateral, vertical, and unconfined microchannels (n ≥ 241 cells; four independent experiments). (G) Phase-contrast image of contiguous microchannels. Cells first experience lateral confinement before transitioning to vertical confinement. Scale bar, 40 μm. (H) Migration speeds of HT-1080 cells inside contiguous channels experiencing first lateral and then vertical confinement (left) or vice versa (right) (n = 150 cells; three independent experiments). (I) Migration speeds of HT-1080 cells in lateral/vertical channels when the basal glass slide of the channel is coated with a thin layer of PDMS (n ≥ 101 cells; two independent experiments). Data represent the mean ± SD (E, F, H, and I) or median (C). **P < 0.01 relative to lateral/unconfined control; §§P < 0.05 relative to myofiber.

