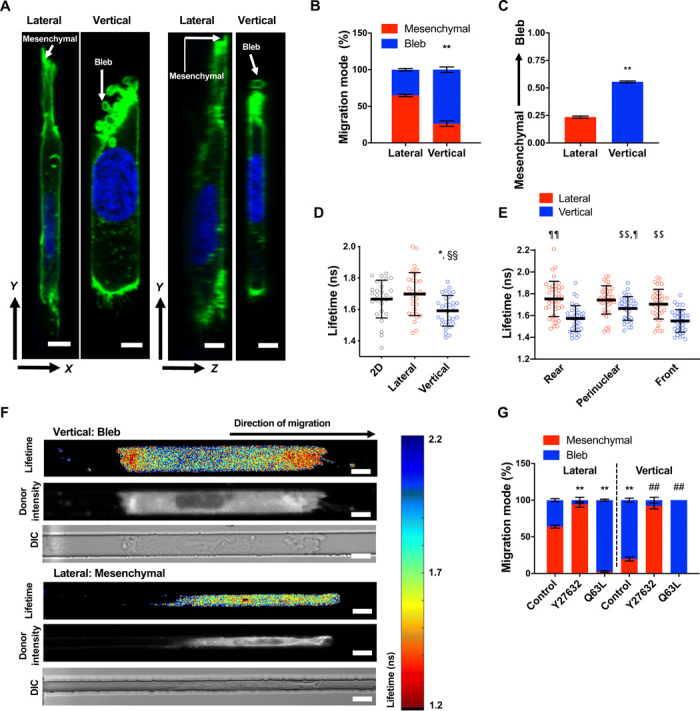
Fig. 3. Channel geometry mediates phenotypic switching of polarized cells by spatially regulating RhoA activity.

(A) Representative XY/YZ images of a mesenchymal and blebbing cell fixed and stained with actin phalloidin (green) and Hoechst (blue) in lateral and vertical confinement, respectively. Scale bar, 5 μm. (B) Percentage of HT-1080 cells migrating with mesenchymal versus blebbing phenotypes in lateral and vertical confinement (n = 3 independent experiments; ≥20 cells per experiment). (C) Average phenotype score (0, mesenchymal; 1, blebbing) of live LifeAct-GFP–labeled HT-1080 cells during migration through contiguous channels (n = 50 cells; three independent experiments). (D) Donor fluorescence lifetime of RhoA activity biosensor inside vertical and lateral microchannels and on 2D, as measured by FLIM-FRET (n ≥ 27 cells; four independent experiments). (E) Spatial distribution of RhoA activity inside vertical microchannels as measured by FLIM-FRET (n ≥ 35 cells; five independent experiments). (F) Heat map of RhoA activity biosensor of representative cells inside vertical or lateral microchannels, as imaged by FLIM-FRET. ns, nanoseconds; DIC, differential interference contrast. Scale bars, 10 μm. (G) Percentage of control, Y27632-treated (10 μM), or constitutively active RhoA (Q63L)–expressing HT-1080 cells, migrating with mesenchymal versus blebbing phenotypes in lateral and vertical confinement (three or more independent experiments; ≥20 cells per condition). Values represent the mean ± SD (D and E) or the mean ± SEM (B, C, and G); *P < 0.05 and **P < 0.01 relative to lateral control; ##P < 0.01 relative to vertical control; §§P < 0.01 relative to 2D; $$P < 0.01 relative to vertical front; ¶P < 0.05 and ¶¶P < 0.01 relative to vertical rear.
