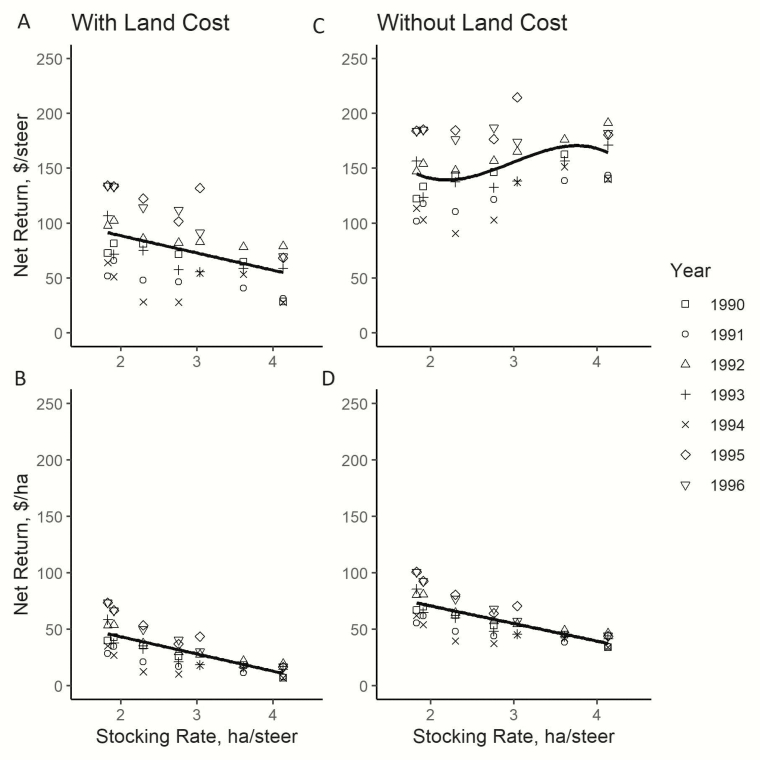
Figure 4.
Net return (NR) over the grazing season at different stocking rates. The black line is the regression equation fit by a linear mixed model using year as a random effect. The points are observations each year for each stocking rate. Net return [both in $/steer (panel A) and $/ha (panel B)] decreased linearly when a fixed cost was attributed to land. When a fixed cost was not attributed to land, NR per steer (panel C) exhibited a cubic relationship, where NR ($/steer) increased at the lightest stocking rates, whereas NR per hectare decreased linearly with lighter stocking rates (panel D).

