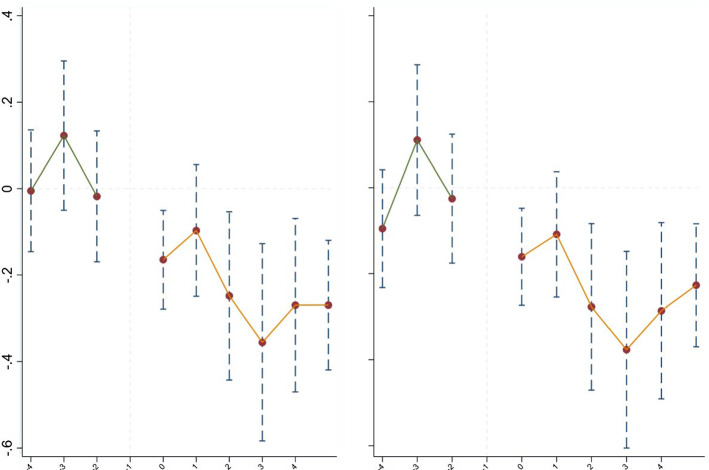
Fig. 1.
Dynamic DID. Note This figure plots the difference of interaction terms’ coefficients between the period before and after the official lockdown day under a continuous treatment variable. The solid line shows the estimated coefficients over time. In each day, the dashed line surrounding the coefficient is 95% confidence intervals of it

